Experiment 7: Spectrum of the Hydrogen Atom 实验 7: 氢原子的光谱
Nate Saffold<br>nas2173@columbia.edu<br>Office Hour: Mondays, 5:30-6:30PM
Nate Saffold<br>nas2173@columbia.edu<br>办公时间: 周一, 5:30-6:30PM
INTRO TO EXPERIMENTAL PHYS-LAB 1493/1494/2699 ## 实验物理实验室入门 1493/1494/2699
Introduction ## 介绍
- The physics behind:
- The spectrum of light
- The empirical Balmer series for Hydrogen
- The Bohr model (a taste of Quantum Mechanics)
- Brief review of diffraction
- The experiment:
- How to use the spectrometer and read the Vernier scale
- Part 1: Analysis of the Helium (He) spectrum
- Finding lattice constant of the grating
- Part 2: Measuring spectral lines of Hydrogen (H)
- Determining the initial state of the electron
- 背后的物理学原理:
- 光的光谱
- 氢的经验性巴尔末系列
- 玻尔模型(量子力学的初步了解)
- 衍射的简要回顾
- 实验内容:
- 如何使用分光计并读取游标刻度
- 第一部分: 氦 (He) 光谱的分析
- 确定光栅的晶格常数
- 第二部分: 测量氢 (H) 的光谱线
- 确定电子的初始状态
Light Spectra ## 光谱
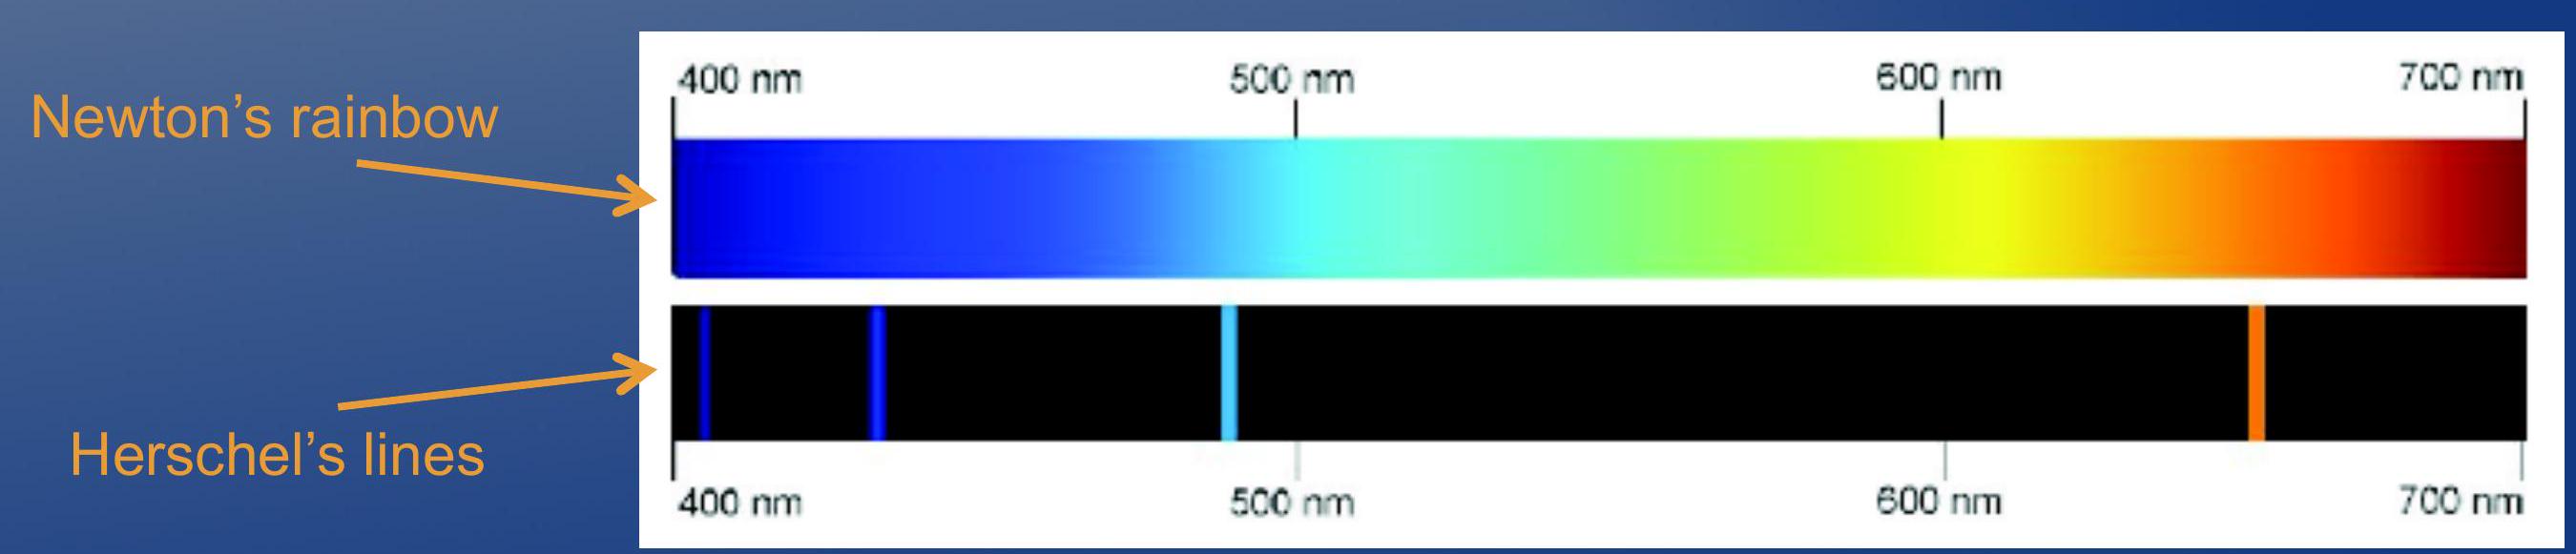
- Isaac Newton (1670): shine sunlight through prism and you will observe continuous rainbow of colors.
- John Herschel (1826): shine light from heated gas through spectroscope, and you will observe monochromatic lines of pure color on a dim/dark background.
- 艾萨克·牛顿 (1670): 将阳光通过棱镜照射,你将观察到连续的彩虹色。
- 约翰·赫歇尔 (1826): 将加热的气体发出的光通过分光镜照射,你将在暗淡的背景上观察到纯色彩的单色线。

Discharge lamps and artificial light ## 放电灯和人造光
- Herschel's discovery of emission spectra from heated gas was studied extensively in the 1800's.
- It was realized that a heated gas emits a unique combination of colors, called emission spectrum, depending on its composition.
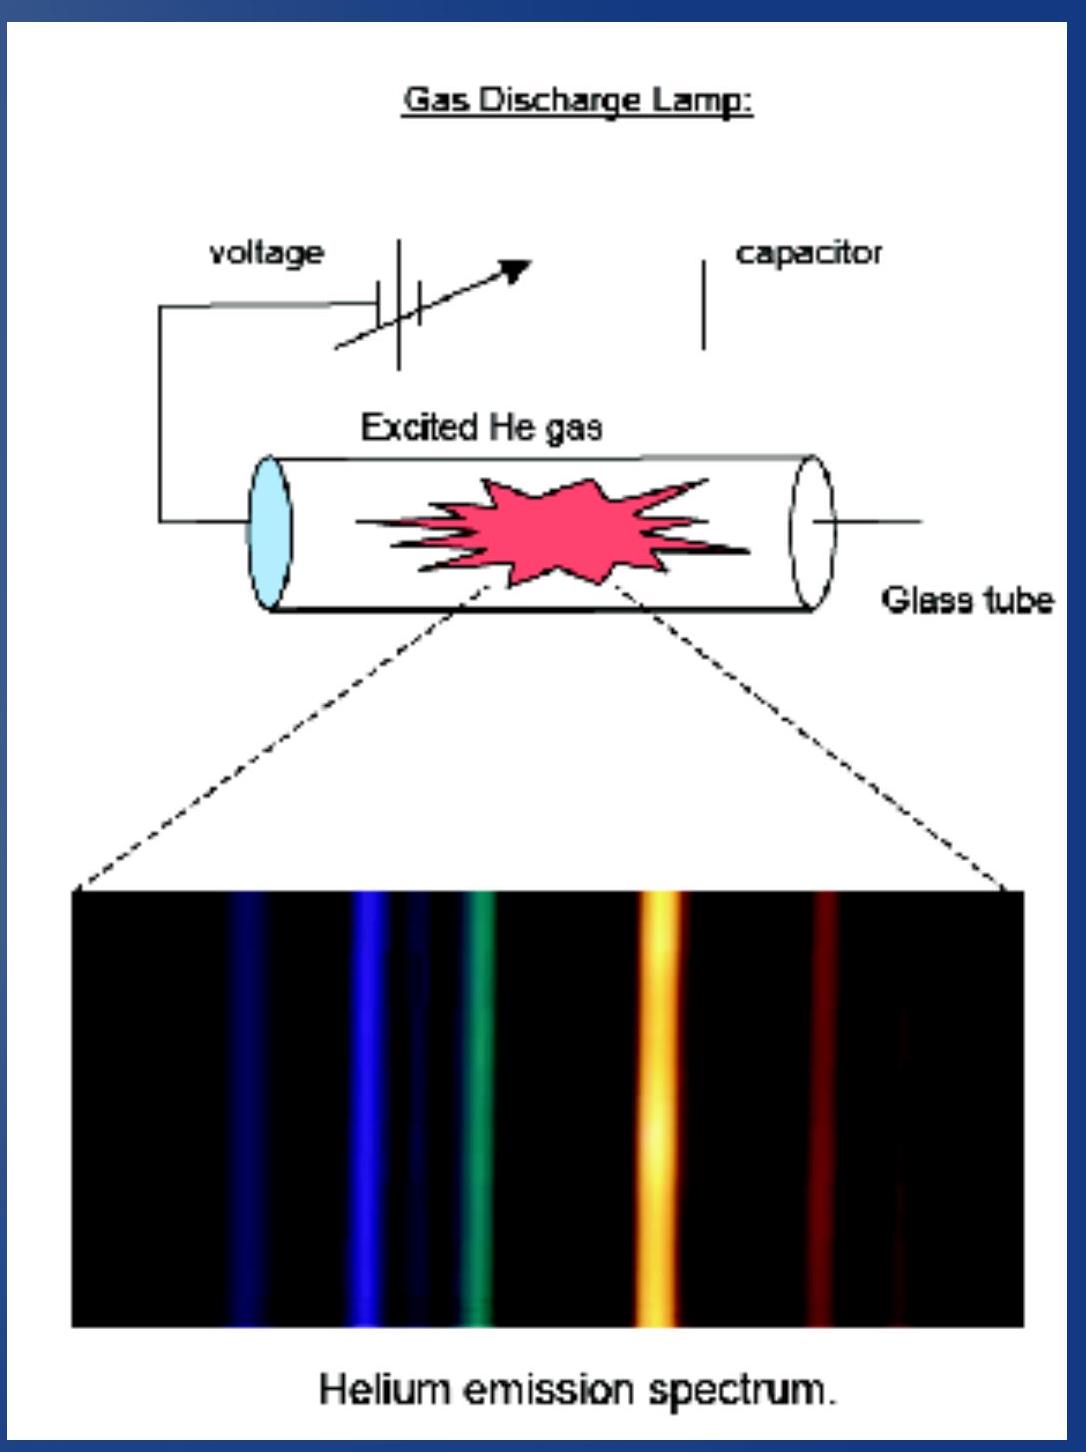
- Example: Helium gas in a discharge lamp.
- Main idea: put a large voltage across the gas. It will break down and emit light. The light emitted is composed of discrete colors.
- 赫歇尔对加热气体的发射光谱的发现在19世纪被广泛研究。
- 人们认识到加热的气体会发出独特的颜色组合,称为发射光谱,这取决于其成分。
- 例子: 放电灯中的氦气。
- 主要思想: 在气体上施加大电压。它会击穿并发出光。发出的光由离散的颜色组成。
Atomic spectra ## 原子光谱
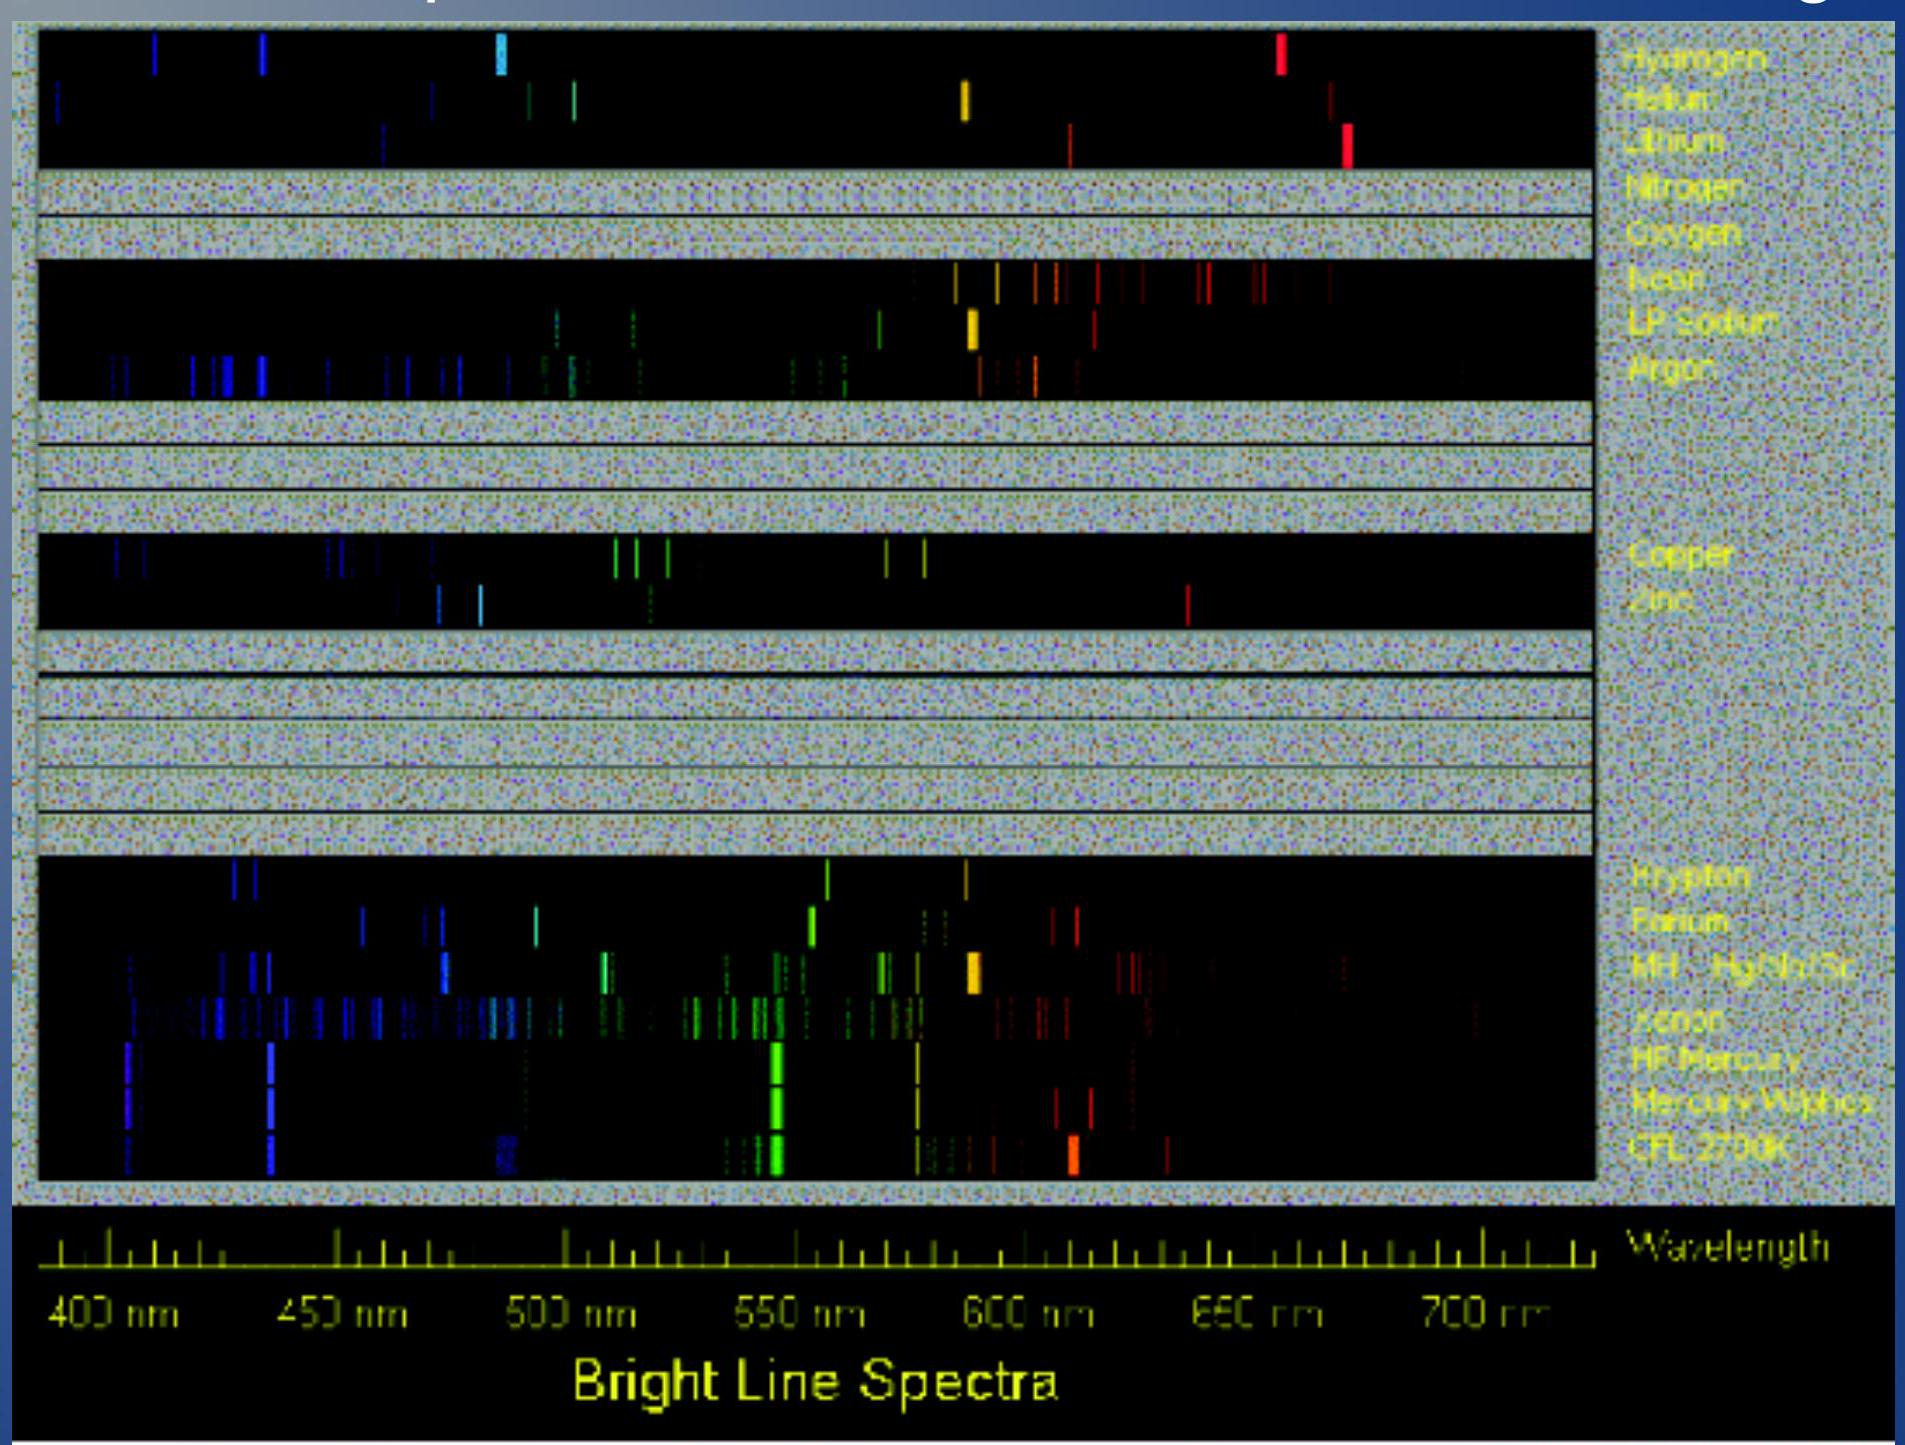
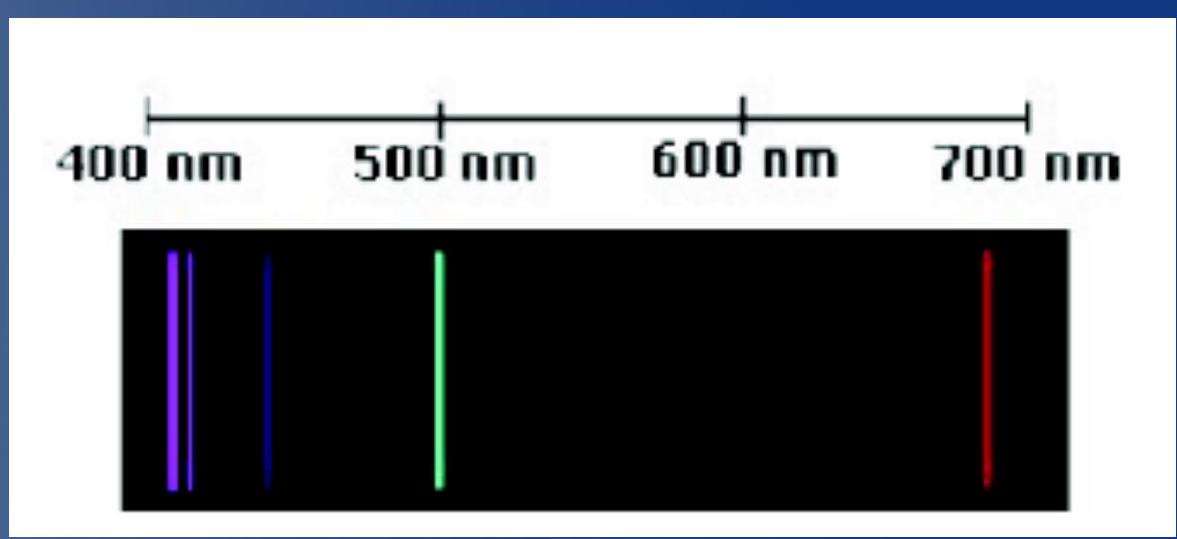
- This is an example of the lines emitted from different gases
- 这是不同气体发出的谱线的例子
PHYS 1493/1494/2699: Exp. 7 - Spectrum of the Hydrogen 物理 1493/1494/2699: 实验. 7 - 氢的光谱
Interlude: Spectra in Astronomy ## 插曲: 天文学中的光谱
- In the century astronomers realized that spectroscopy can be used as a powerful tool to study stars
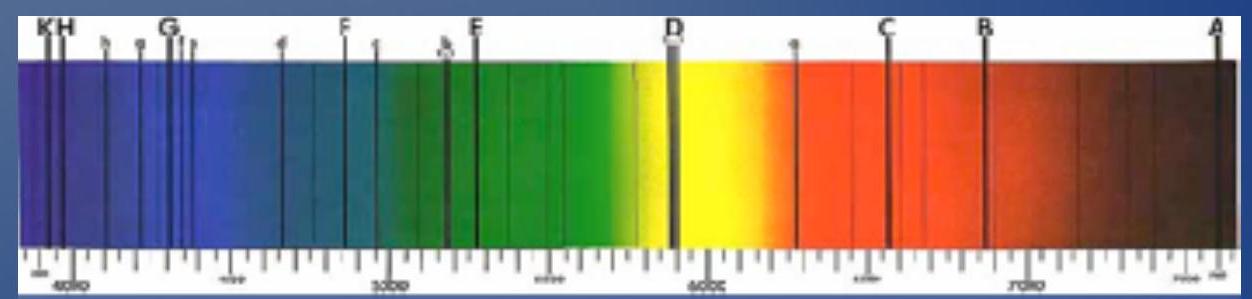
- 1802: William Wollaston observed sunlight separated into colors by a prism; he noticed dark lines in the spectrum at definite locations.
- 1817: Joseph Fraunhofer observed these spectral lines in other stars as well. Sometimes they are the same, sometimes they are different.
- They correspond to the absorption (not emission!) of some wavelengths due to the most external elements of the solar gas
- Implication: The stars are made of the same stuff as Earth!
- 在19世纪,天文学家意识到光谱学可以作为研究恒星的强大工具
- 1802年: 威廉·沃拉斯顿观察到被棱镜分离成颜色的阳光;他注意到光谱中在特定位置有暗线。
- 1817年: 约瑟夫·夫琅禾费也在其他恒星中观察到这些光谱线。有时它们是相同的,有时它们是不同的。
- 它们对应于由于太阳气体最外层元素导致的某些波长的吸收(而非发射!)
- 含义: 恒星由与地球相同的物质组成!
Interlude: How stars emit light ## 插曲: 恒星如何发出光
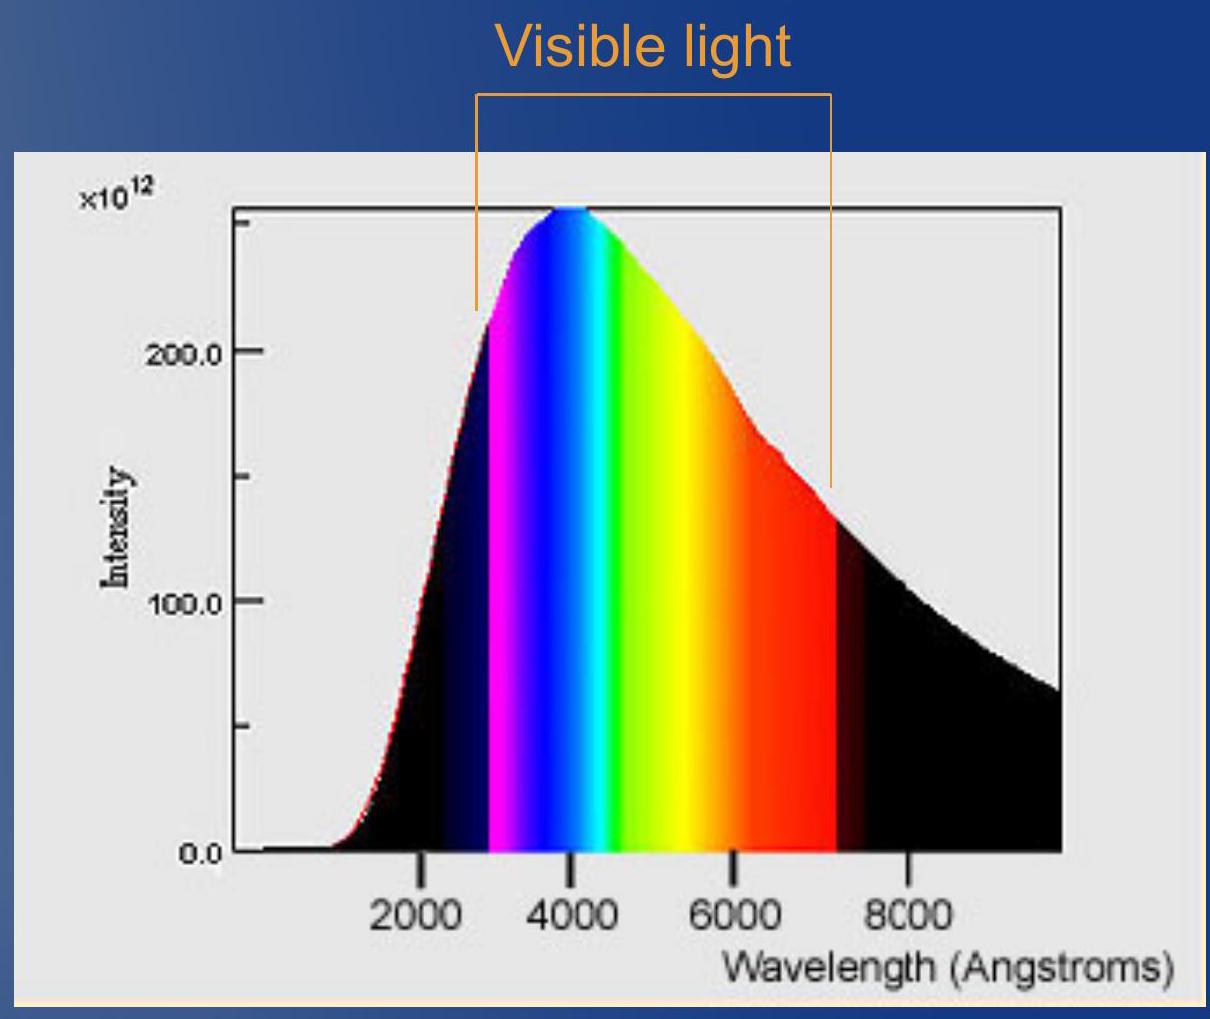
- Emitted spectrum: Very hot stellar center emits continuous (blackbody) radiation
- From the core all the wavelengths are emitted (just like a rainbow)
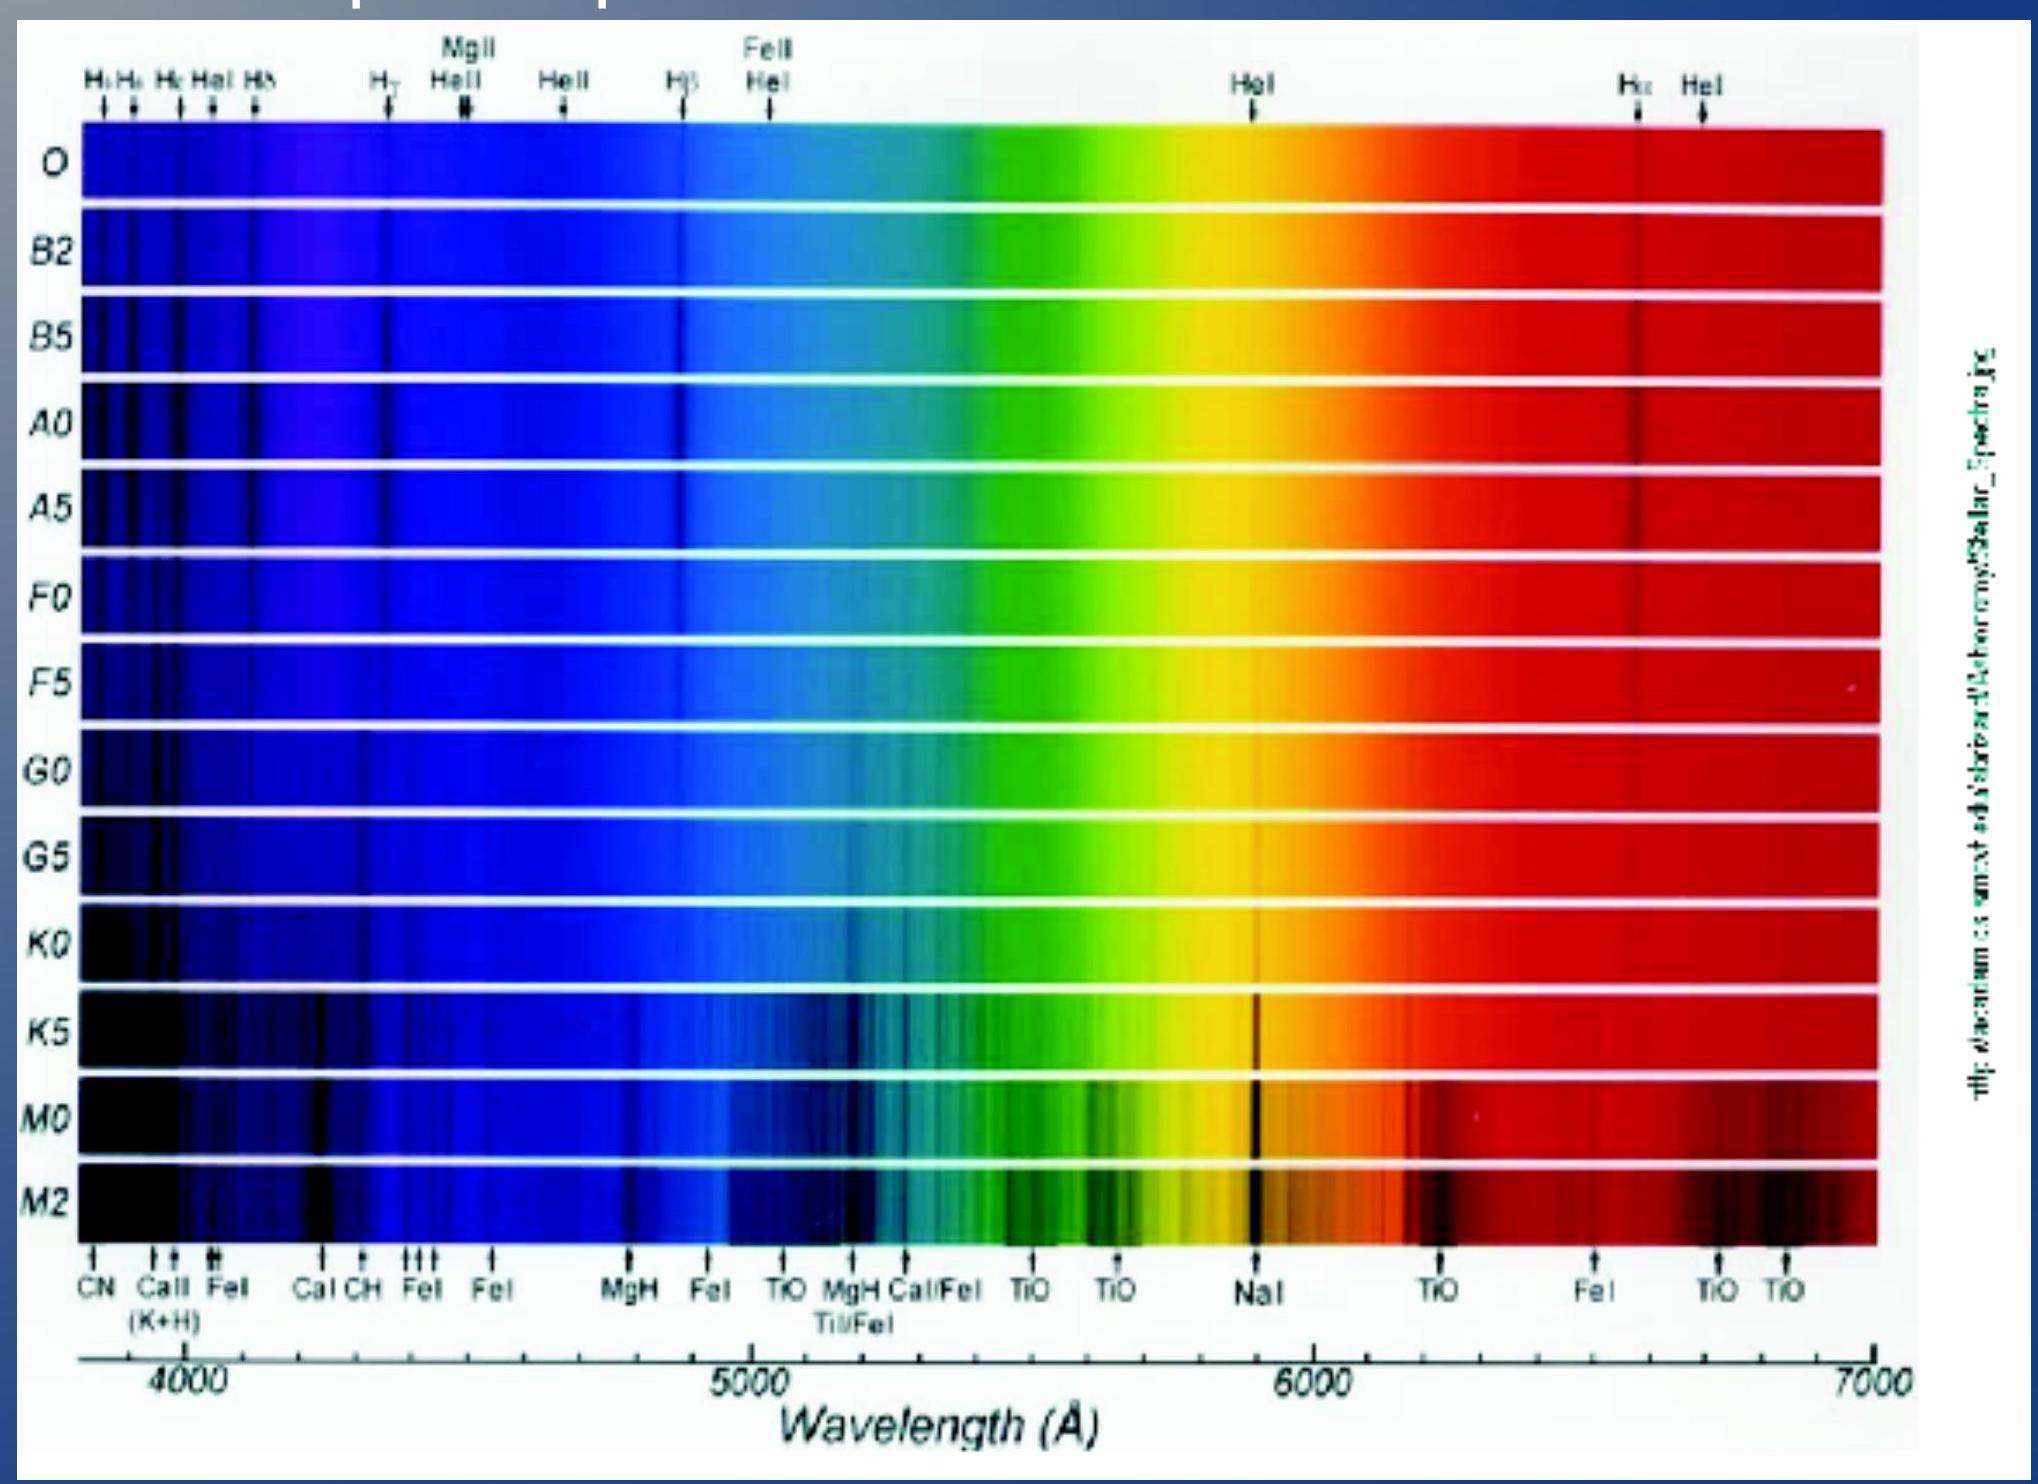
- Observed spectrum: Before arriving to us the light passes through surface of stars
- Gases at surface absorb light at characteristic wavelengths
- Therefore, we detect all the wavelengths but the one absorbed. This generates the Fraunhofer's lines
- 发射光谱: 非常热的恒星中心发出连续的(黑体)辐射
- 从核心发出所有波长(就像彩虹一样)
- 观测光谱: 在到达我们之前,光通过恒星的表面
- 表面的气体在特征波长处吸收光
- 因此,我们检测到除了被吸收的之外的所有波长。这产生了夫琅禾费线
Interlude: How stars emit light ## 插曲: 恒星如何发出光
- Star's absorption spectrum:
- 恒星的吸收光谱:
The Balmer formula ## 巴尔末公式
- J.J. Balmer discovers (1885) that the quantized (discrete) visible emission spectrum of the hydrogen follows a mathematical formula:
- He found the following expression for the wavelength of the absorption lines completely empirically. He did not provide any physical explanation for it:
- Different values of correspond to different line series discovered by several scientists before Balmer himself:
- (Lyman Series)
- (Balmer Series) which is visible
- (Paschen, Brackett, Pfund)
- J.J. 巴尔末在1885年发现氢的量子化(离散)可见发射光谱遵循一个数学公式:
- 他完全经验性地找到了吸收线的波长的以下表达式。他没有为此提供任何物理解释:
- 的不同值对应于巴尔末本人之前几位科学家发现的不同谱线系列:
- (莱曼系列)
- (巴尔末系列) 这是可见的
- (帕邢、布拉克特、普芬德)
Example: the visible spectrum ## 例子: 可见光谱
- For the Balmer series (visible spectrum) we fix
- If we then change we obtain:
- yields (red)
- yields (green)
- yields (blue)
- yields (purple)
- The Balmer's equation describes the observed lines very accurately
NOTE: in the real experiment you will perform:
- "Green" looks bluish-green
- "Blue" looks purple
- "Purple" looks dark violet. It will be very hard to see...
- But what is the physics?
- 对于巴尔末系列(可见光谱),我们固定
- 如果我们改变,我们得到:
- 产生 (红色)
- 产生 (绿色)
- 产生 (蓝色)
- 产生 (紫色)
- 巴尔末方程非常准确地描述了观察到的谱线
注意: 在实际实验中,你将观察到:
- "绿色"看起来是蓝绿色
- "蓝色"看起来是紫色
- "紫色"看起来是深紫罗兰色。它将很难看到...
- 但这背后的物理学原理是什么?
Bohr's model for H atom ## 玻尔模型与氢原子
- In 1913 Neils Bohr proposed a physical model to describe the spectrum of the hydrogen atom. It was the birth of Quantum Mechanics!
- He hypothesizes that the angular momentum of an electron in orbit around a proton is quantized (i.e. it can only be a discrete multiple of a certain number):
- 1913年,尼尔斯·玻尔提出了一个物理模型来描述氢原子的光谱。这标志着量子力学的诞生!
- 他假设围绕质子运行的电子的角动量是量子化的(即它只能是某个特定数值的离散倍数):
- Under this simple assumption he managed to compute the energy of the electron around the atom:
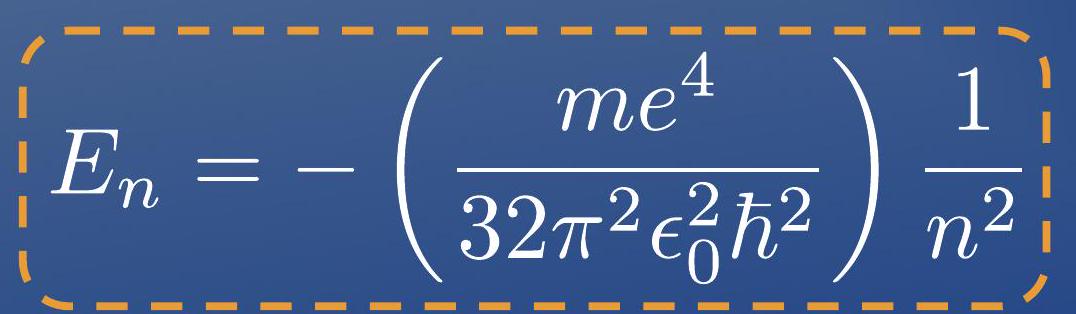
- As a consequence, the energy of the electron around the nucleus is also quantized!
- 在这个简单的假设下,他成功计算出了围绕原子的电子的能量:
- 作为结果,电子围绕原子核的能量也是量子化的!
Bohr's model for H atom ## 玻尔模型与氢原子
- In a real life experiment we can never measure the energy of the electron. We can however measure differences in its energy
- Suppose that an electron makes a transition from a level to a level with
- In order to conserve energy it will have to emit a photon with energy exactly
- Quantum mechanically the energy of a single photon is related to its wavelength as
- Therefore, the wavelength of the emitted photon is:
- 在实际的生活实验中,我们永远无法测量电子的能量。但是,我们可以测量其能量的差异
- 假设一个电子从能级 跃迁到能级 其中
- 为了保持能量守恒,它必须发射一个能量恰好为 的光子
- 从量子力学角度看,单个光子的能量与其波长相关,表示为
- 因此,发射光子的波长为:
- This perfectly describes the spectrum of the hydrogen atom!
- 这完美地描述了氢原子的光谱!
Towards Quantum Mechanics ## 迈向量子力学
- The Bohr's model was a very first step towards a new paradigm of physics
- It still had unresolved problems like:
- Could not capture some subtle properties of H atoms
- Does not apply to other kinds of elements
- Eventually the development of Quantum Mechanics (1920's) lead to a description of matter that is still in agreement with experiments today
- However, the main idea present in the Bohr's model remains: some physical
- 玻尔模型是朝着物理学新范式迈出的第一步
- 它仍然存在一些未解决的问题,如:
- 无法捕捉氢原子的一些微妙特性
- 不适用于其他种类的元素
- 最终,量子力学的发展(20世纪20年代)导致了对物质的描述,这种描述至今仍与实验保持一致
- 然而,玻尔模型中的主要思想仍然存在:某些物理
Since 1838 In a warid where nuthing is real you have to look beyond reality. quantities like energy and angular momentum can be discrete. This changes everything!
自1838年起 在一个现实中一切都不真实的世界里,你必须超越现实去看。像能量和角动量这样的量可以是离散的。这改变了一切!
Spectroscopy ## 光谱学
- How can we measure the energy levels (spectrum) of the hydrogen atom?
- We CANNOT measure individual energy levels!
- We ARE ABLE TO measure indirectly the transition of an electron from one state to another.
- Absorotion and emission of photons.
- 我们如何测量氢原子的能级(光谱)?
- 我们无法测量单个能级!
- 我们能够间接测量电子从一个状态到另一个状态的跃迁。
- 光子的吸收和发射。
Spectroscopy ## 光谱学
- How can we measure the energy levels (spectrum) of the hydrogen atom?
- We CANNOT measure individual energy levels!
- We ARE ABLE TO measure indirectly the transition of an electron from one state to another.
- Absorption and emission of photons.
- Absorption spectroscopy: Shine a range of various wavelength radiation on a sample and measure the wavelengths that get absorbed (excitation of atoms).
- Not the kind of spectroscopy we will use
- Emission spectroscopy: Given a sample of excited atoms, measure the radiation that is emitted by the atoms.
- This will be the principle behind this week's experiment.
- 我们如何测量氢原子的能级(光谱)?
- 我们无法测量单个能级!
- 我们能够间接测量电子从一个状态到另一个状态的跃迁。
- 光子的吸收和发射。
- 吸收光谱学:将各种波长辐射的范围照射到样品上,并测量被吸收的波长(原子的激发)。
- 这不是我们将使用的光谱学的类型
- 发射光谱学:给定一个激发原子的样品,测量由原子发射的辐射。
- 这将是本周实验背后的原理。
The emission spectrum of hydrogen ## 氢的发射光谱
- Energy levels of the hydrogen atom:
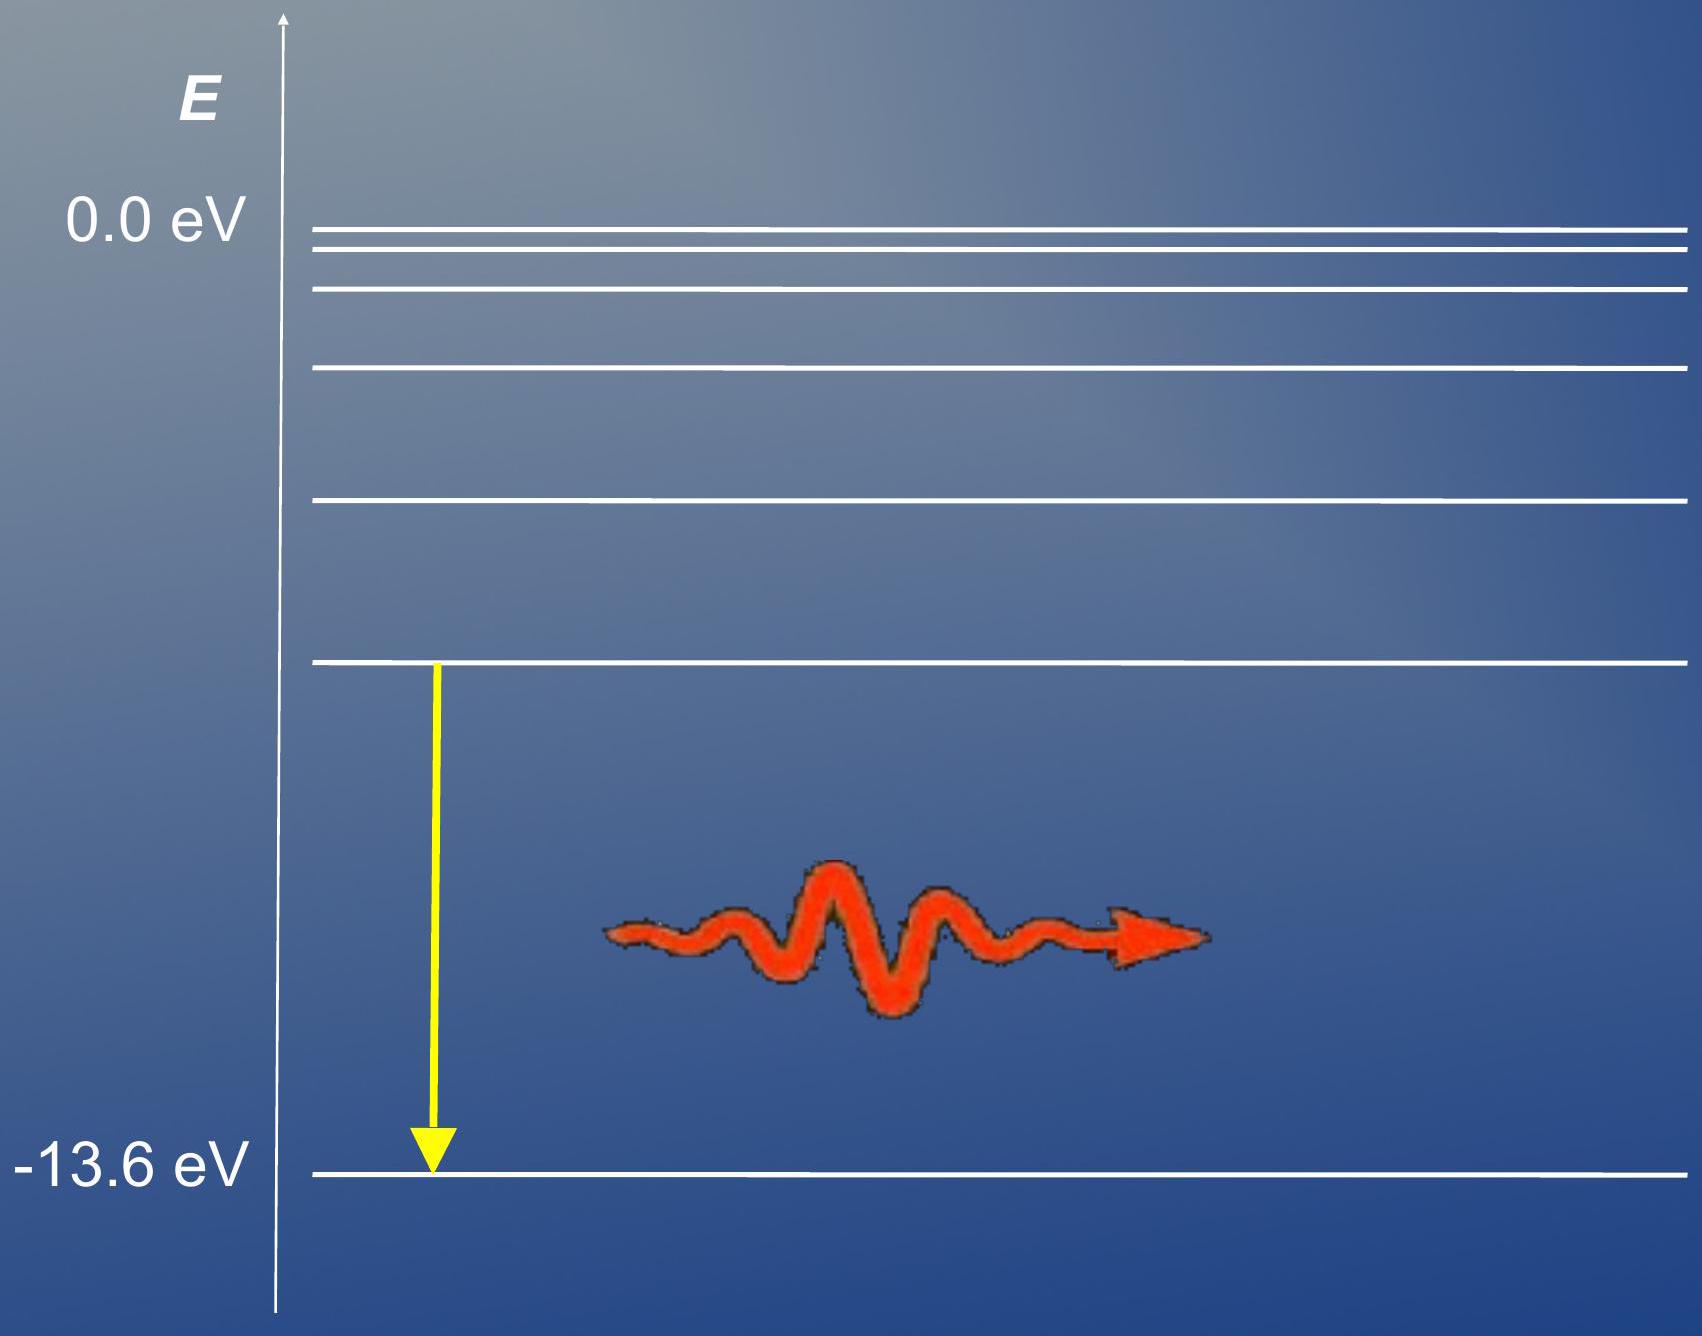
- 氢原子的能级:
De-excitation of electron results in emission of photon
电子的去激发导致光子的发射
The emission spectrum of hydrogen ## 氢的发射光谱
- Livman series: It is made of all the de-excitations that end up on the level
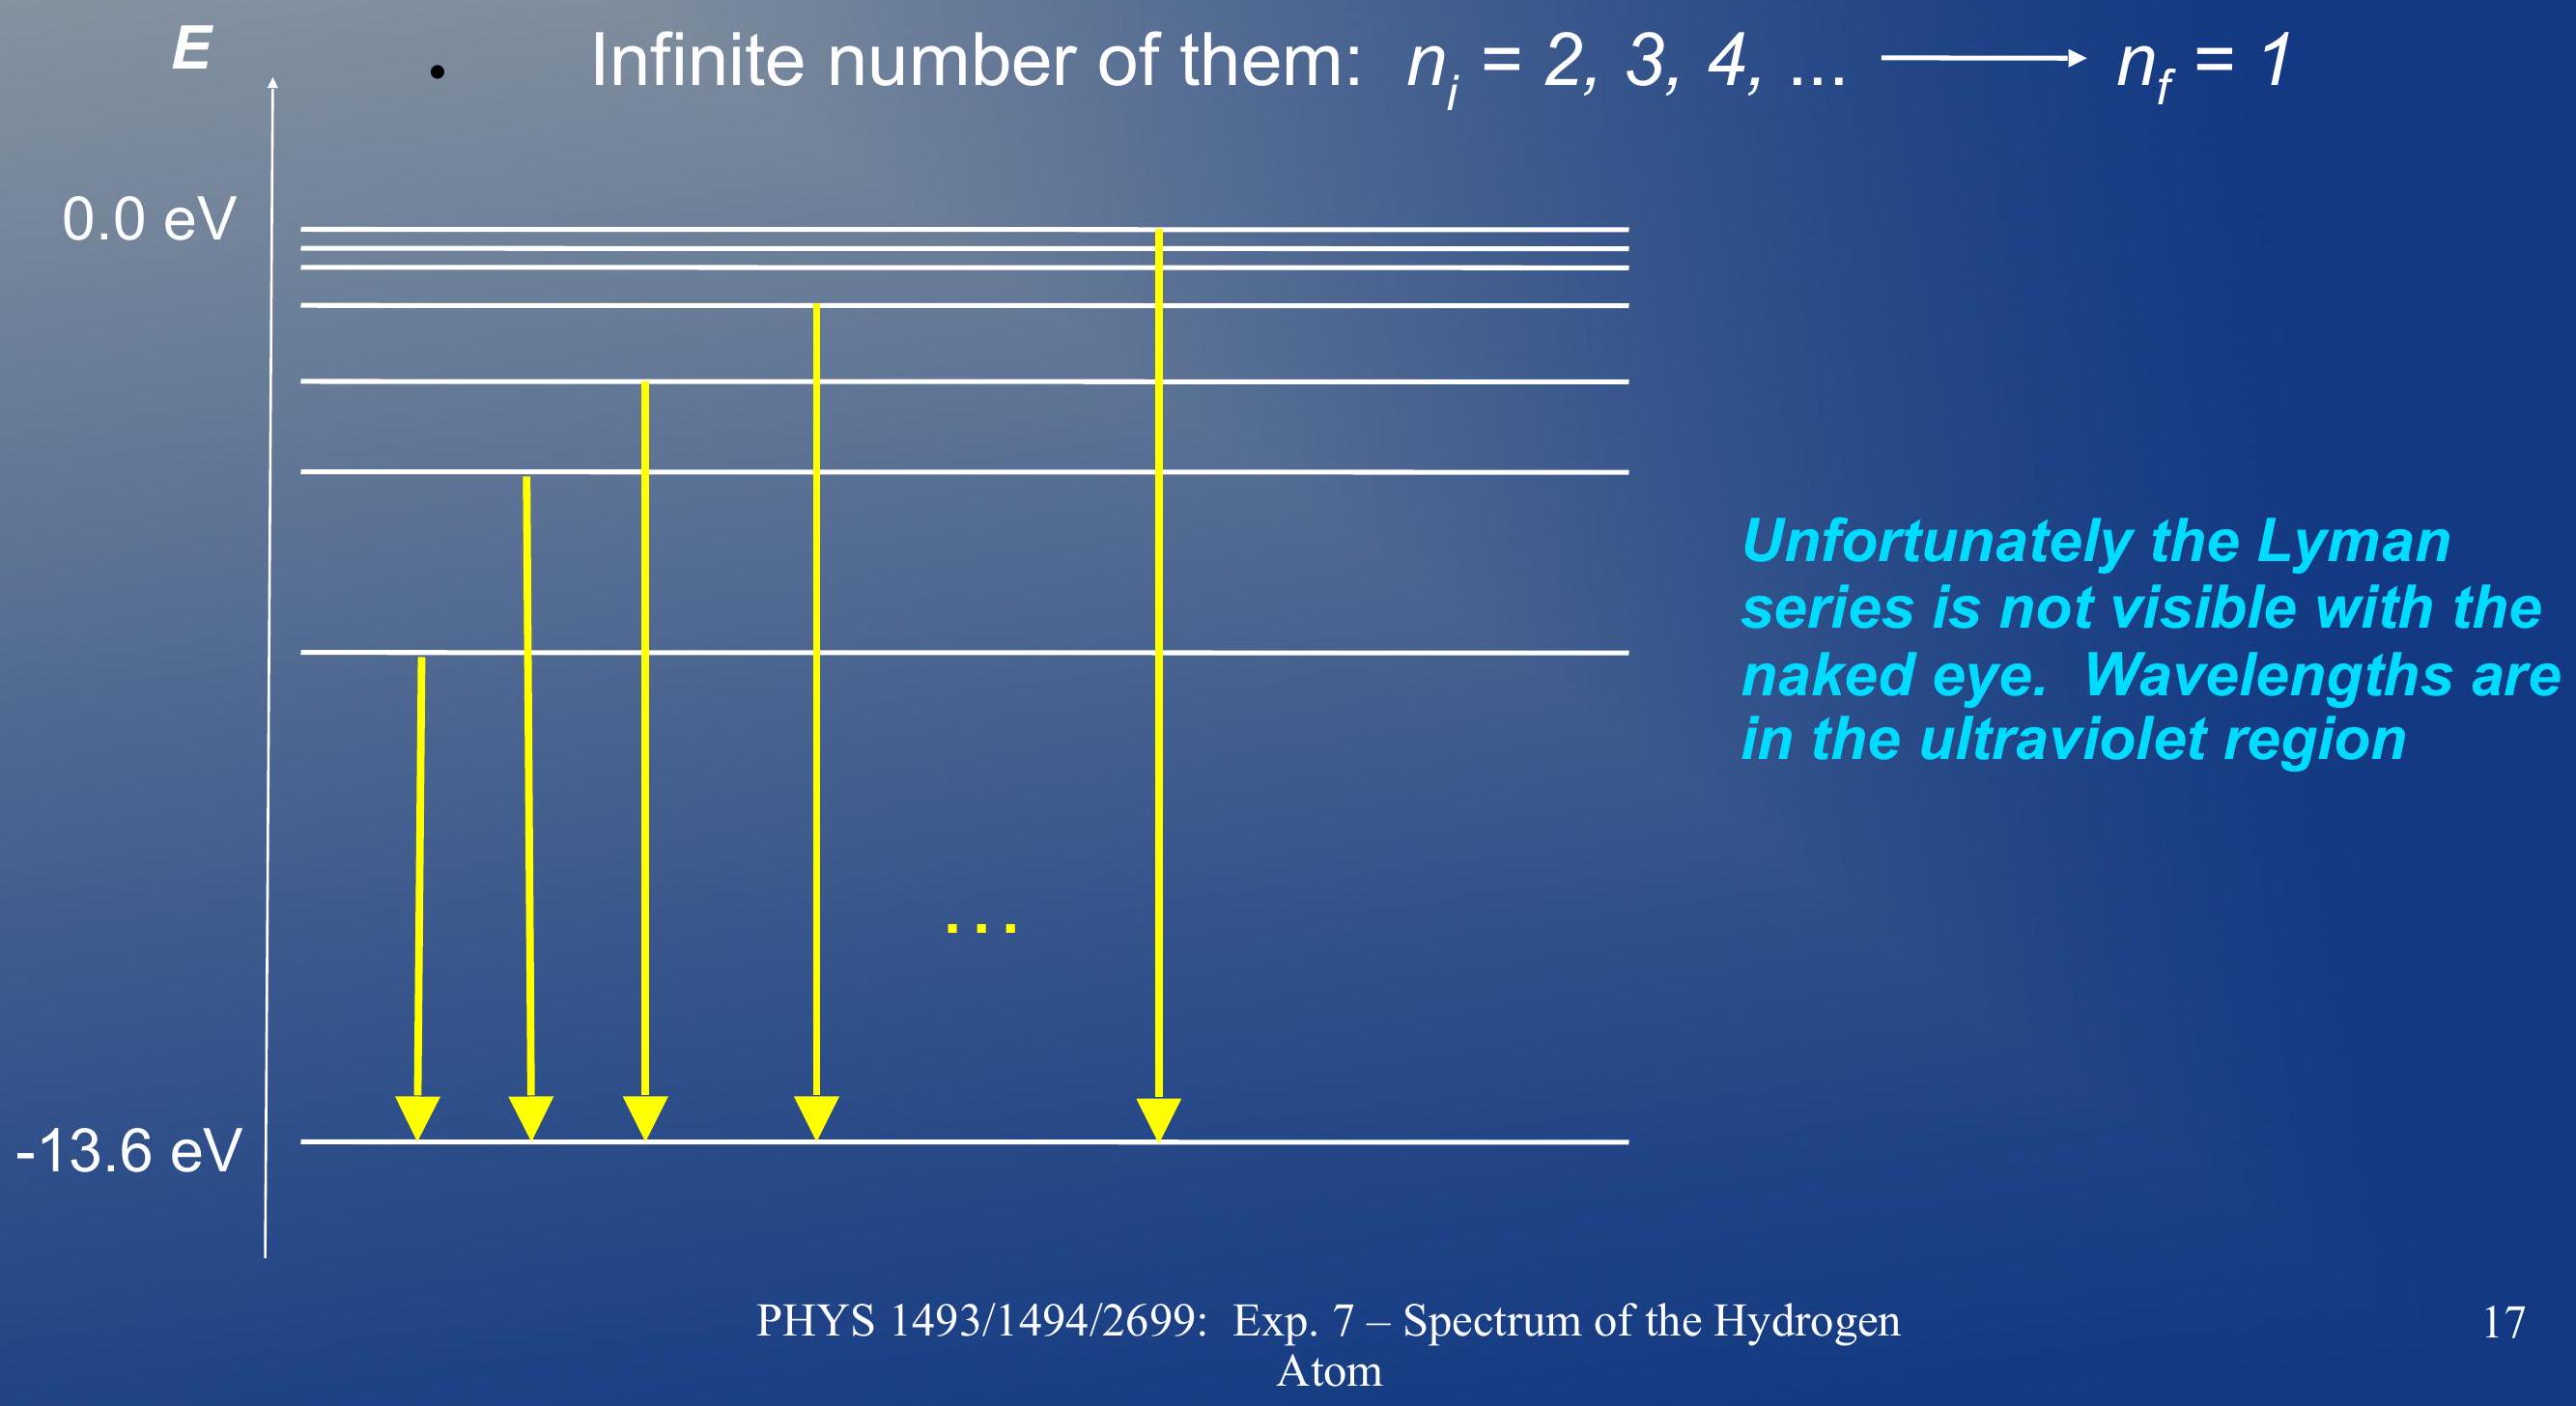
- 莱曼系列:它由所有最终到达 能级的去激发组成
The emission spectrum of hydrogen ## 氢的发射光谱
- Balmer series: All de-excitation emissions to the state
- Infinite number of them:
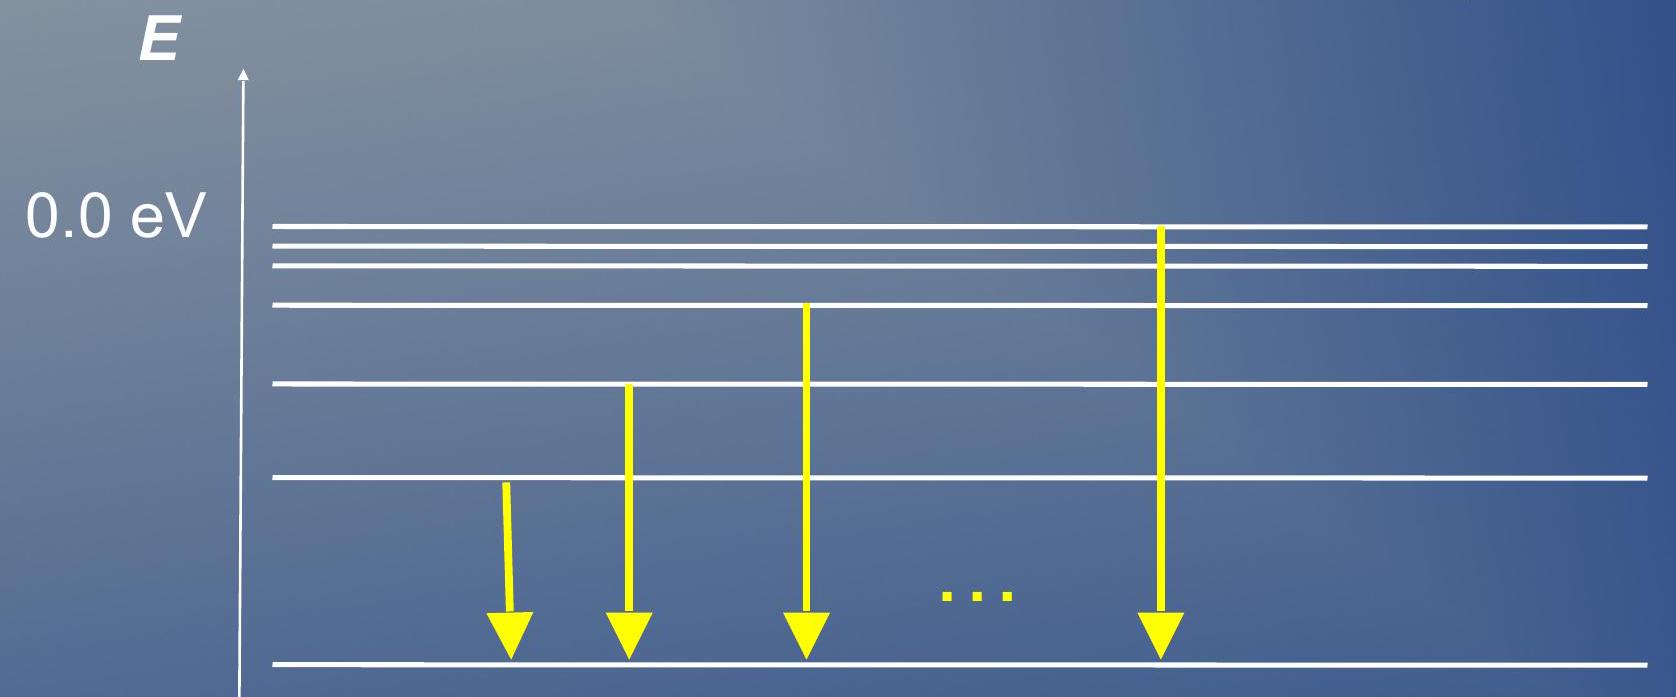
- 巴尔末系列:所有到 状态的去激发发射
- 它们有无限数量:
Contrary to the Lymann one, the Balmer series is visible to the naked eye!
与莱曼系列相反,巴尔末系列肉眼可见!
Review: interference of light ## 回顾:光的干涉
- Question: How can we measure the wavelength of the emitted light?
- Answer: We can use interference!
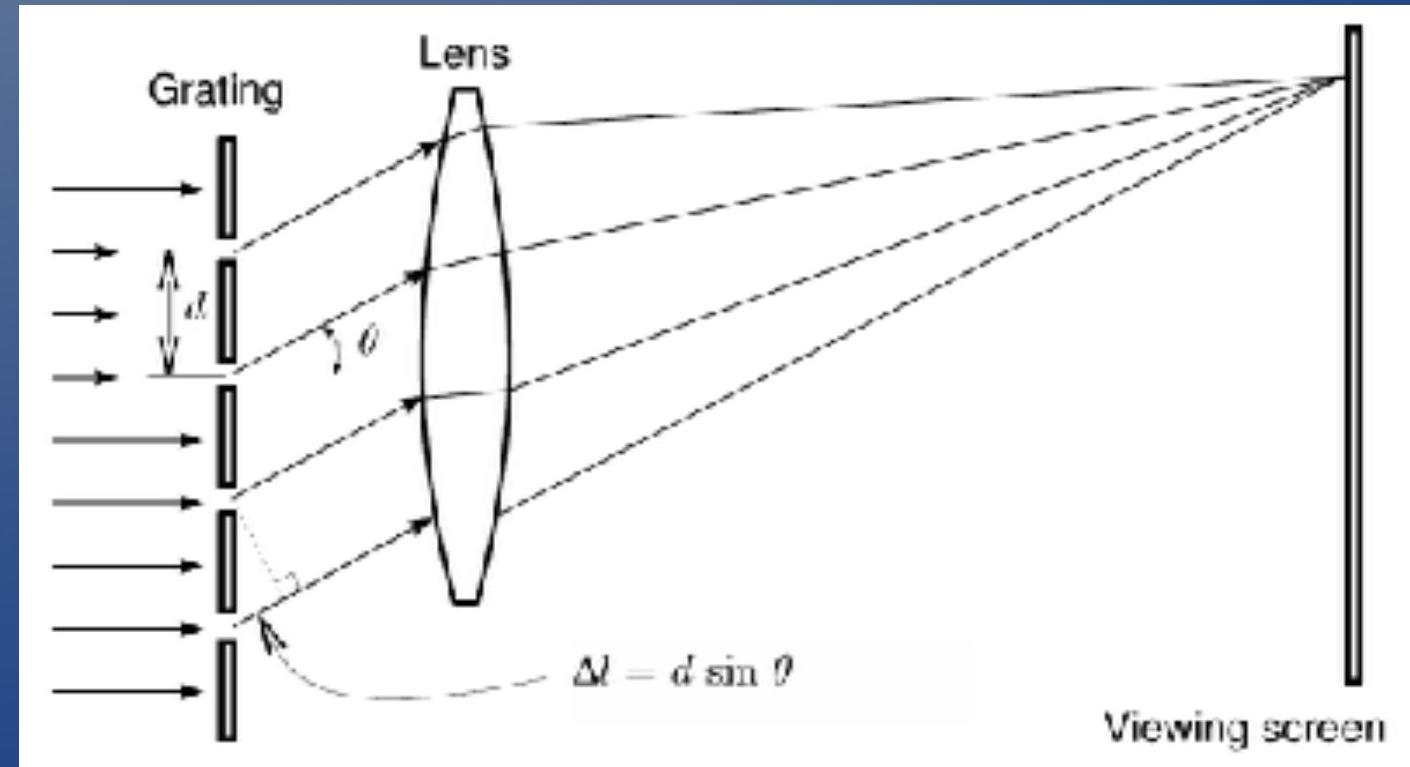
- Recall: For slits with spacing , the condition for constructive interference (bright spots) is:
- 问题:我们如何测量发射光的波长?
- 答案:我们可以使用干涉!
- 回顾:对于间距为 的狭缝,构造性干涉(亮斑)的条件是:
Review: interference of light ## 回顾:光的干涉
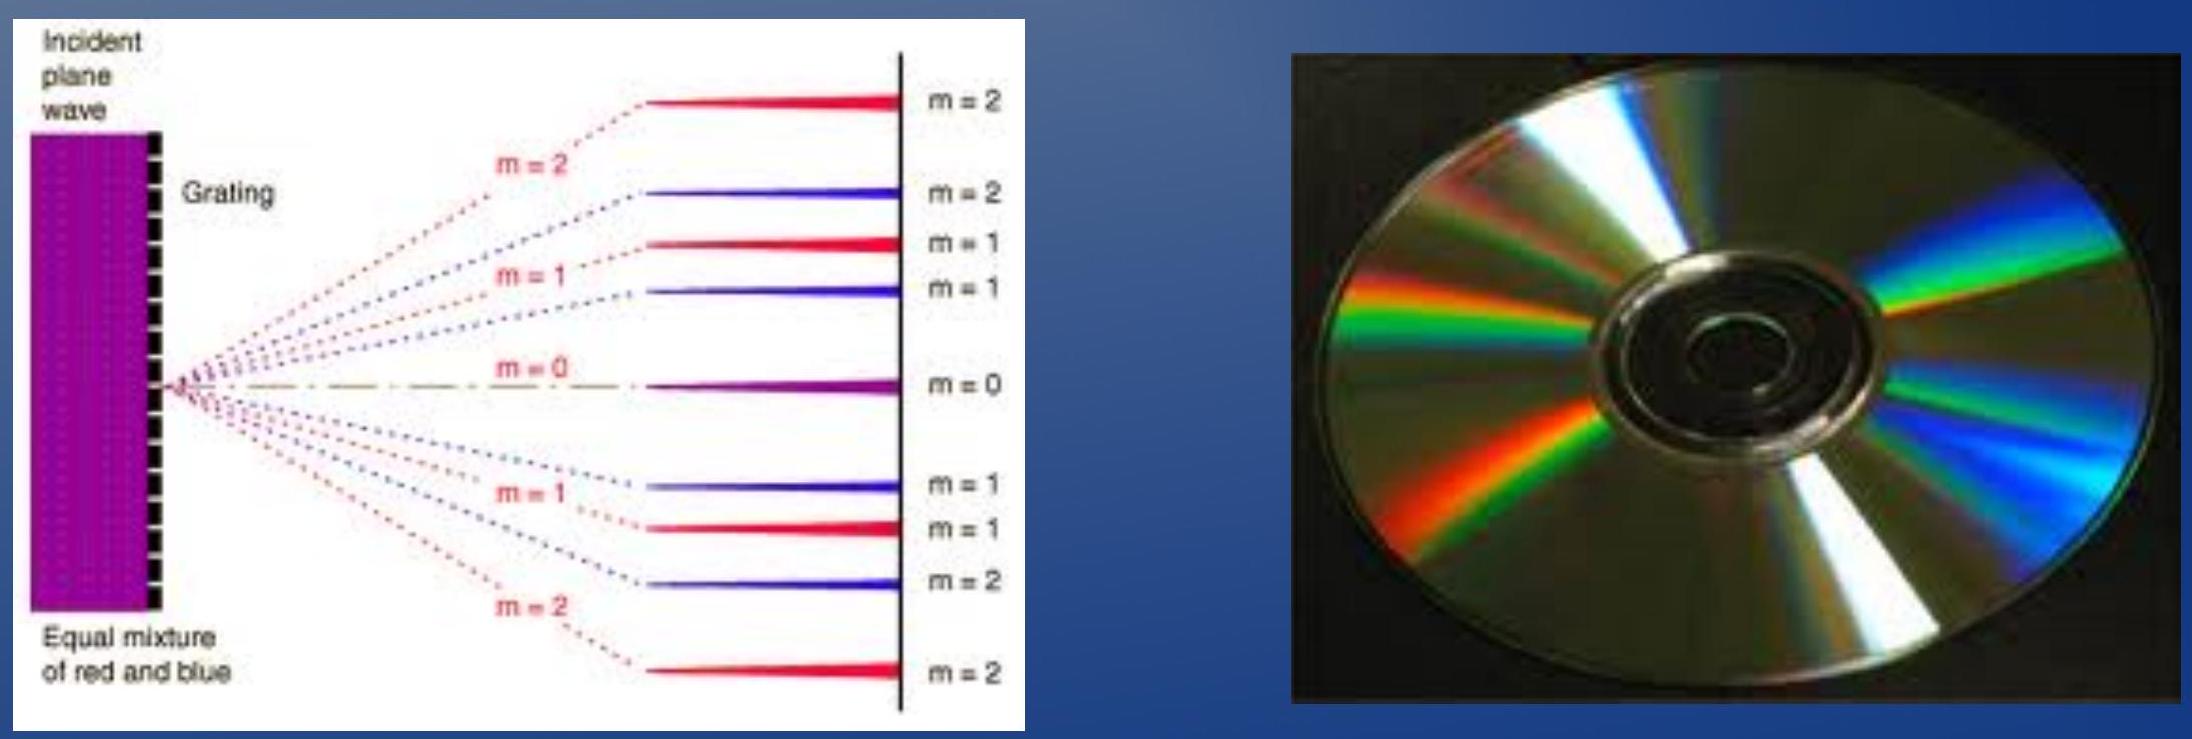
- One feature of this equation is the it is wavelength dependent.
- 这个方程的一个特点是它依赖于波长。
- Consequence: Each wavelength will interfere at a different angle:
- 结果:每个波长将在不同的角度干涉:
- A diffraction grating can be used as a wavelength separator!
- 衍射光栅可以用作波长分离器!
The Experiment ## 实验
Main goals ## 主要目标
- As usual this experiment is divided in two parts. The first one is preliminary and used for "calibration". The second one is the actual measure of interest
- Part 1: Calibration
- Determine the lattice constant (" " in previous eqns.) of the diffraction grating
- Use He discharge lamp for a line with known wavelength (effectively a calibration)
- Part 2: Balmer series
- Four visible de-excitation emission lines (i.e. wavelengths)
- Measure the angle of interference
- Calculate initial state of transition
- Tips
- 通常,这个实验分为两个部分。第一部分是初步的,用于"校准"。第二部分是实际的兴趣的测量
- 第一部分:校准
- 确定衍射光栅的晶格常数(前面方程中的" ")
- 使用氦放电灯的已知波长的谱线(实际上是一种校准)
- 第二部分:巴尔末系列
- 四条可见的去激发发射线(即波长)
- 测量干涉的角度
- 计算跃迁的初始状态
- 提示
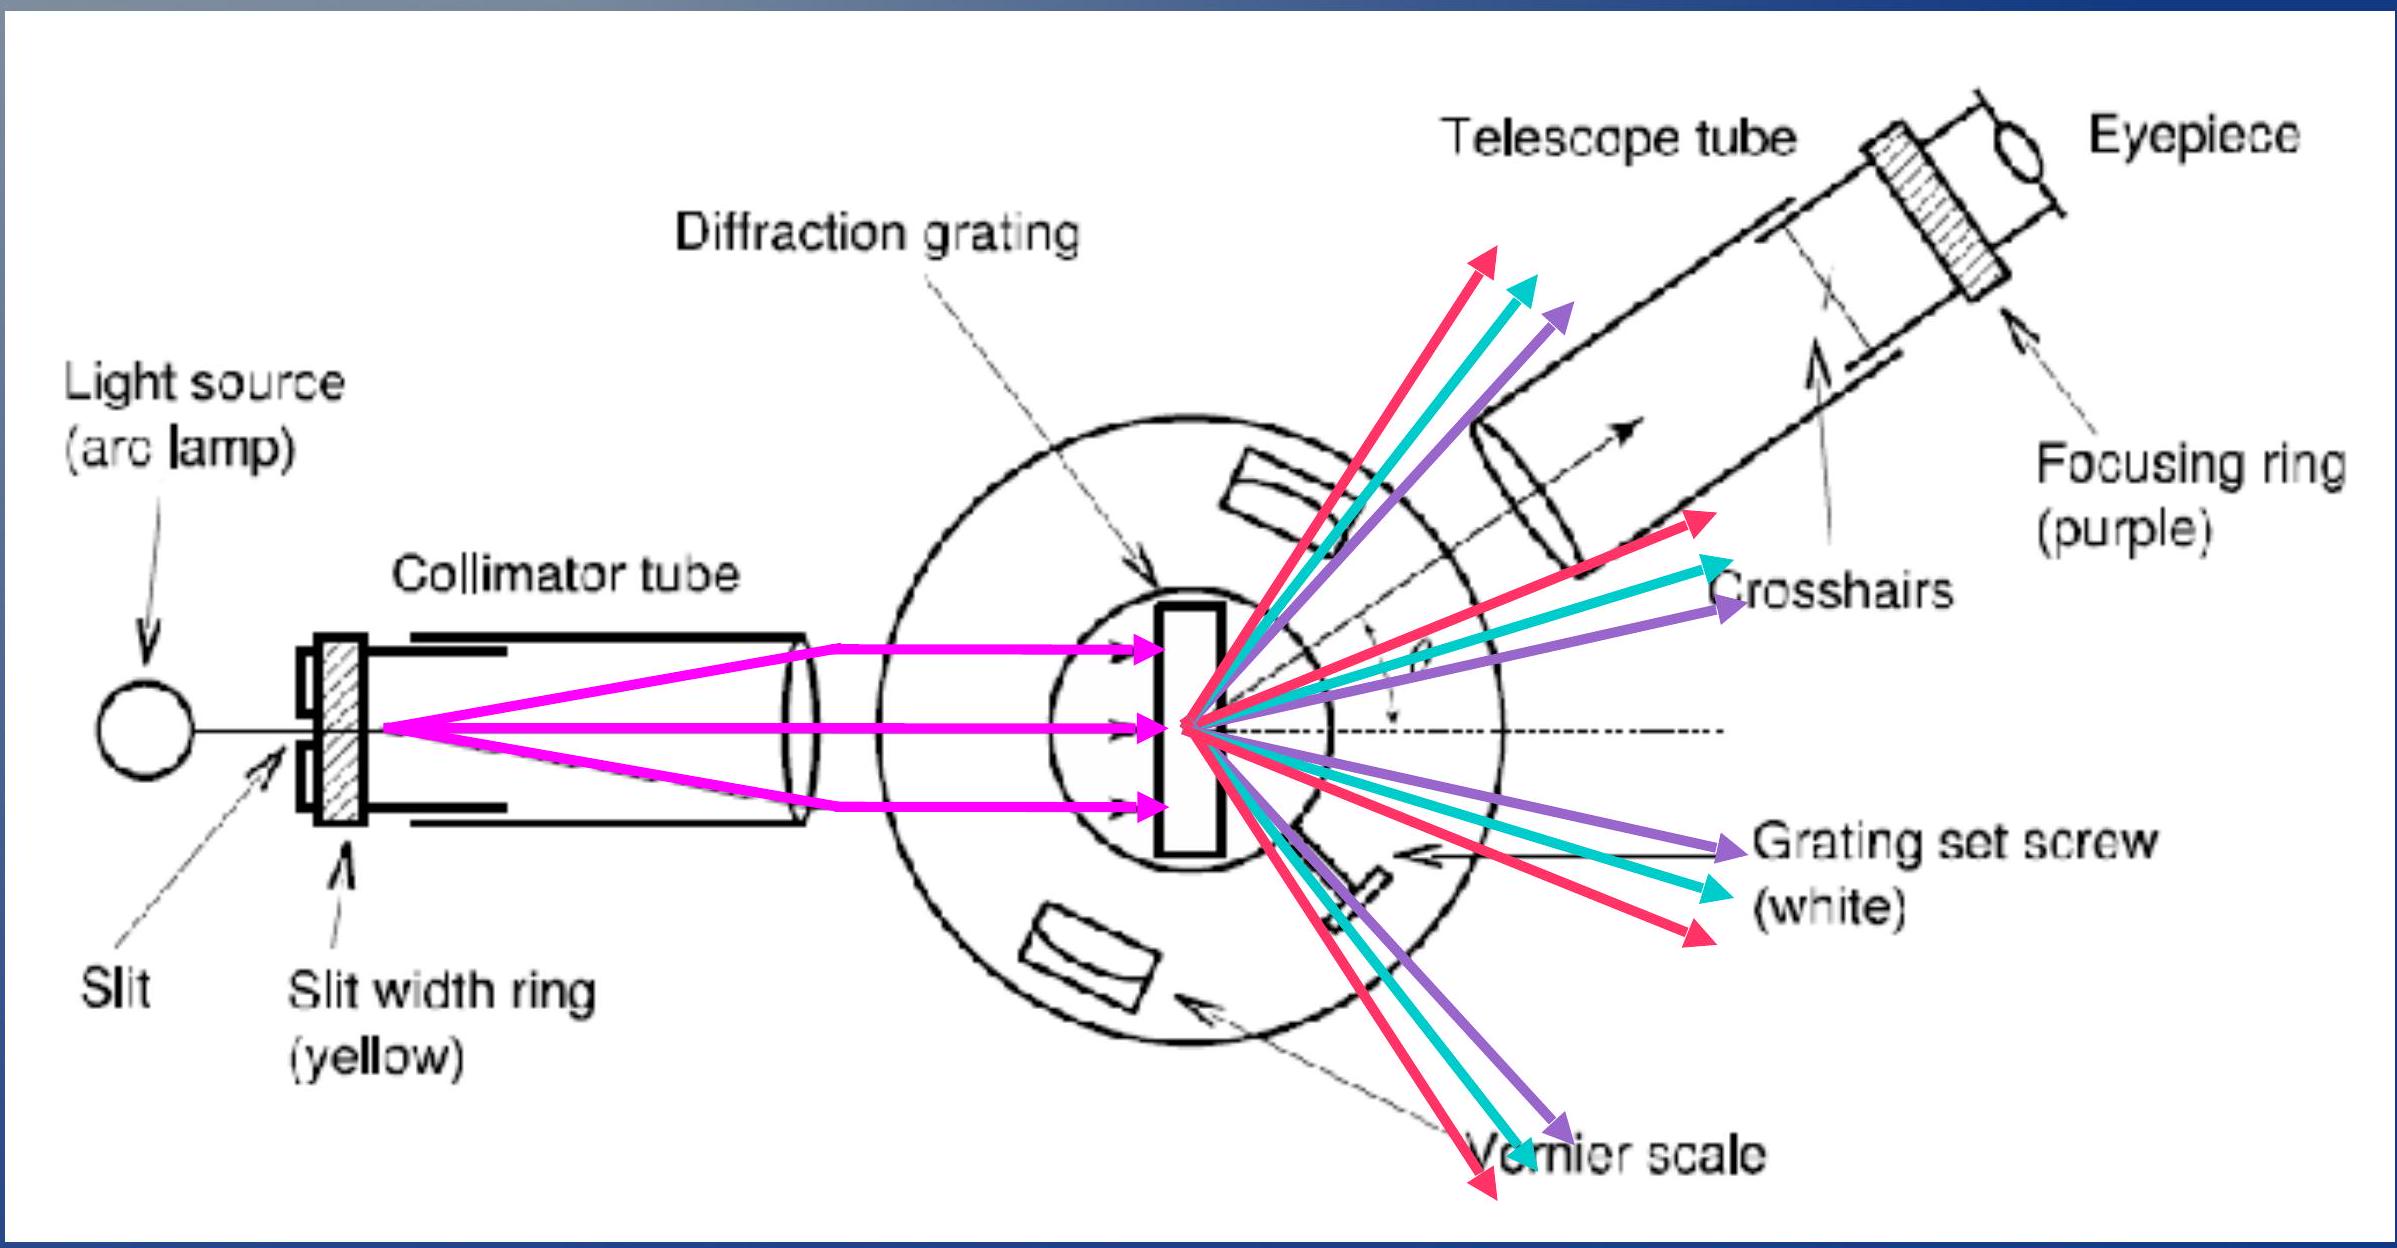
Equipment ## 设备
You can rotate the telescope tube and change the angle
您可以旋转望远镜管并改变角度
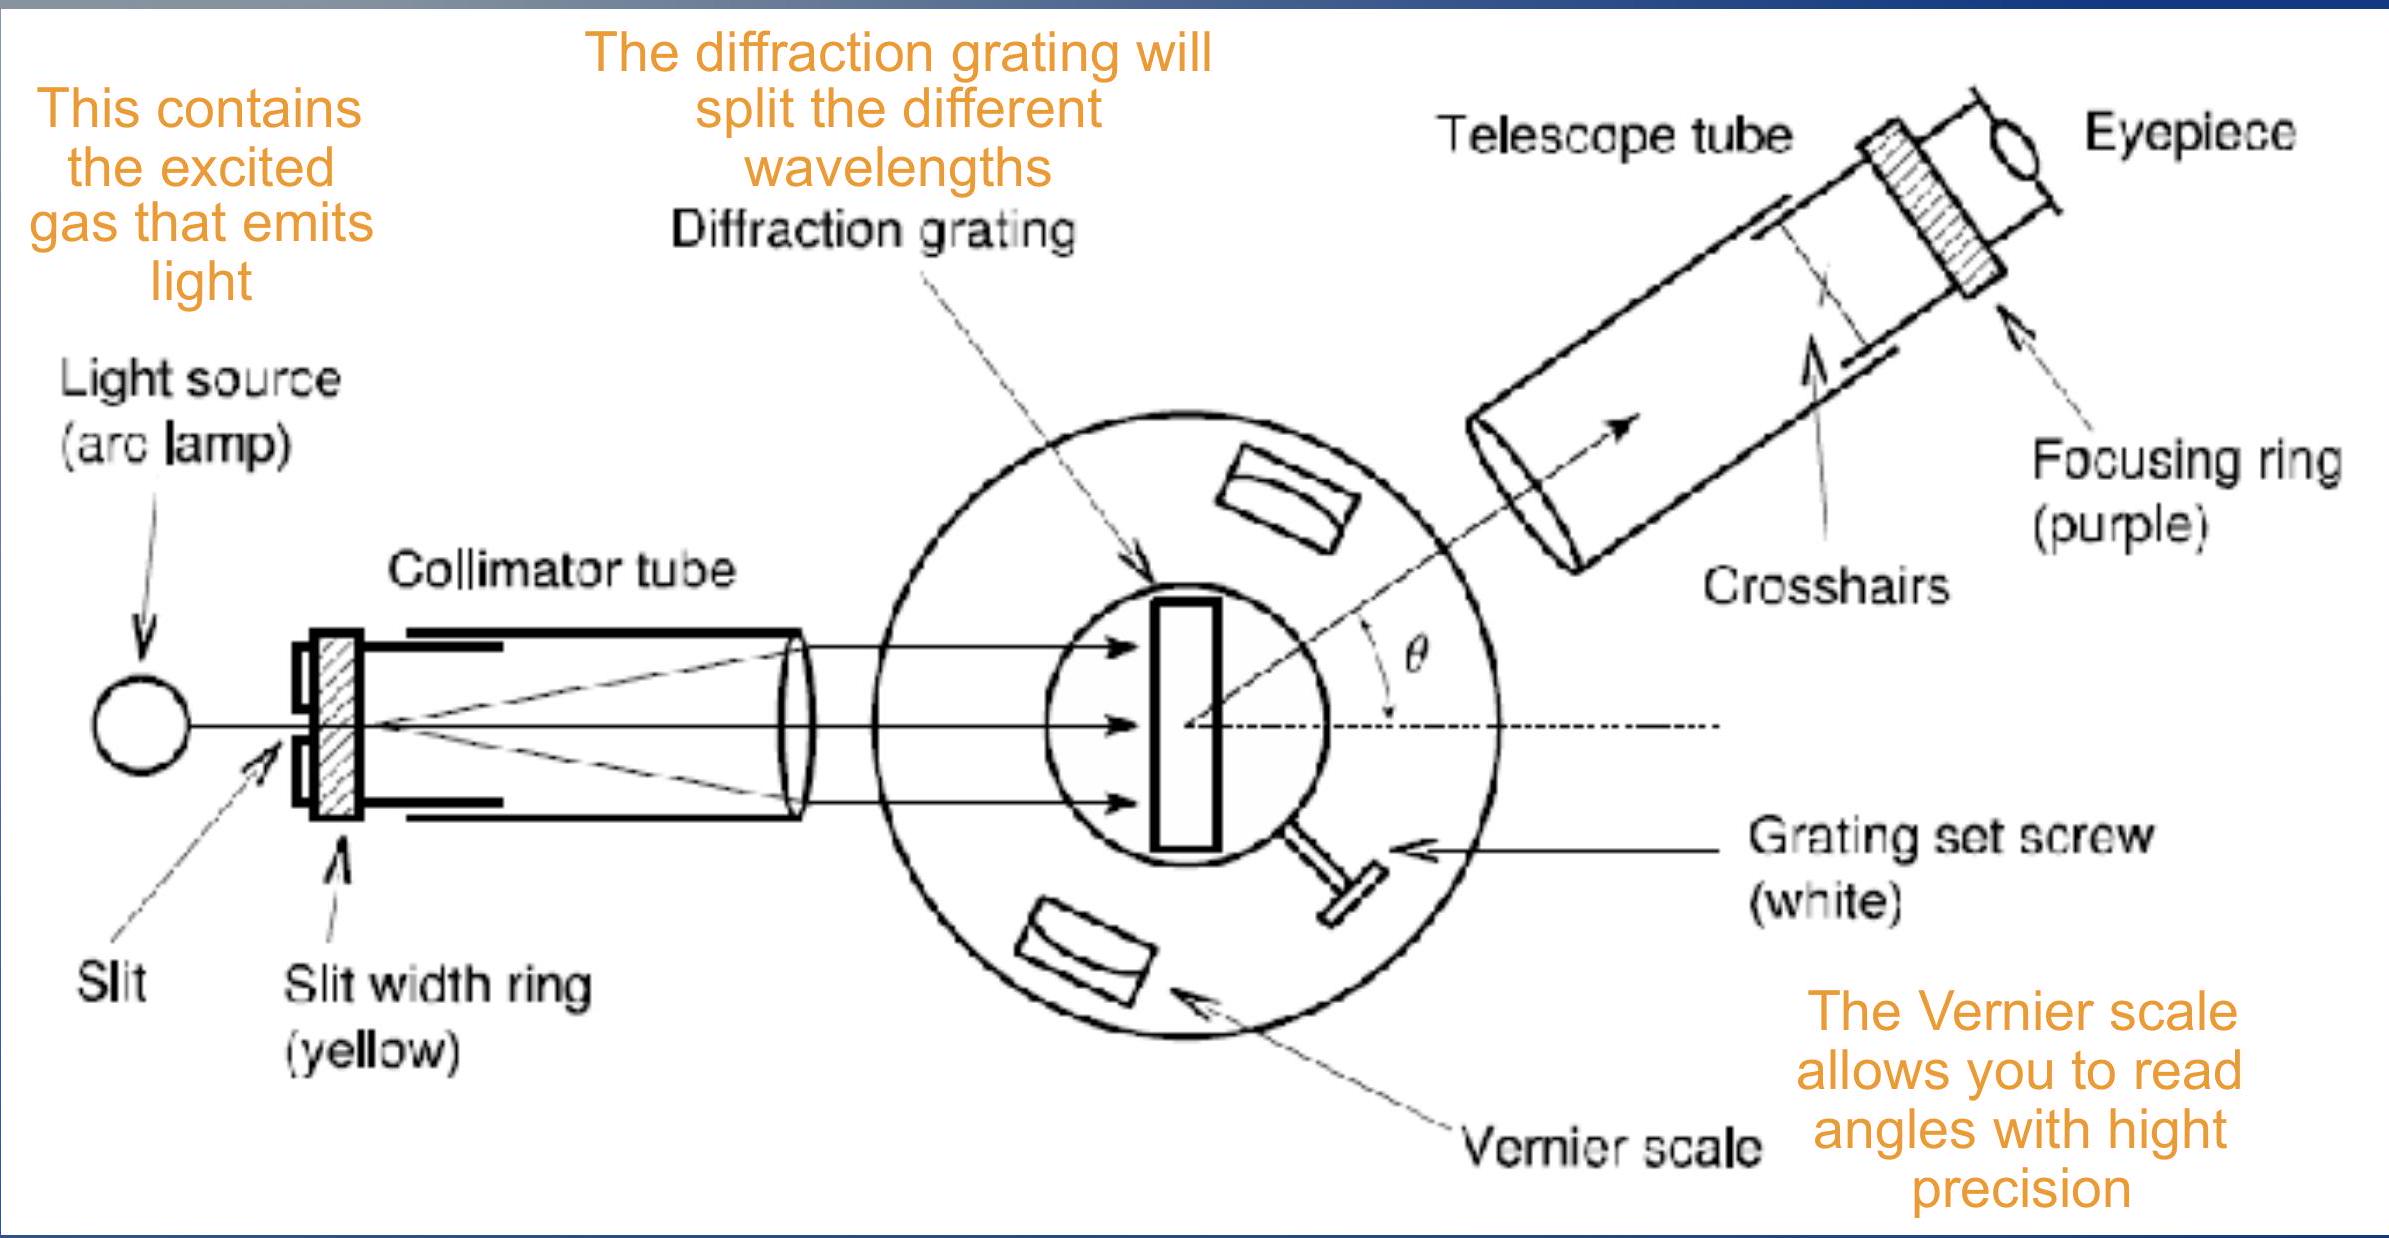
Equipment ## 设备
- Light is emitted from the arc lamp and focused with a lens ## - 光从弧光灯发出并通过透镜聚焦
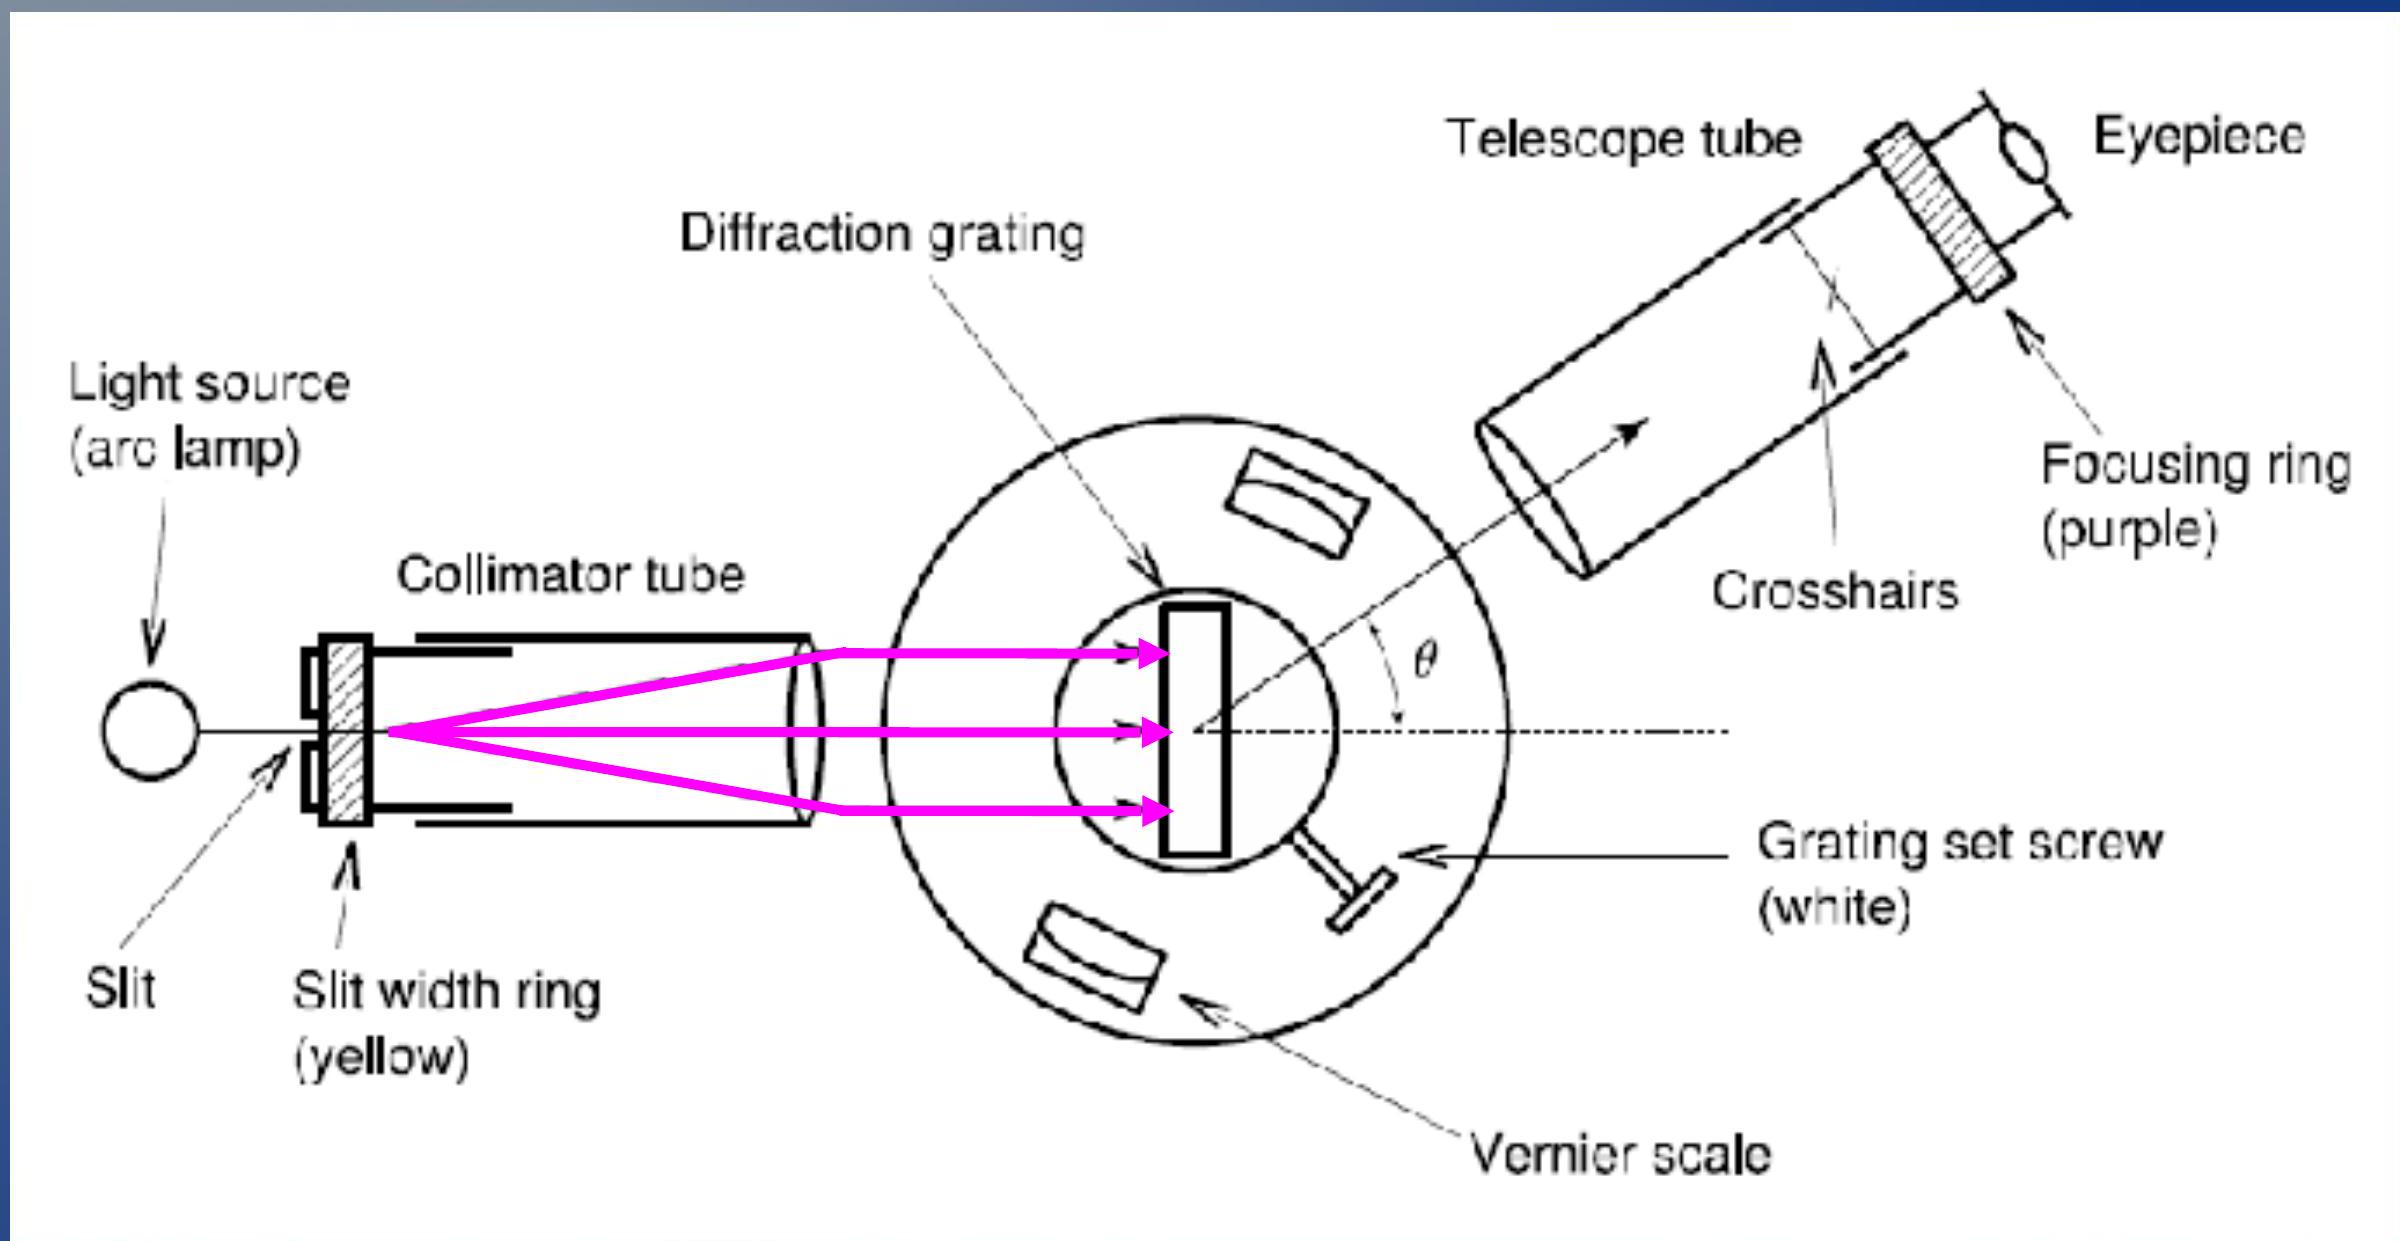
Equipment ## 设备
- When it reaches the diffraction grating, every wavelength is deviated with a different angle. By looking at the Vernier scale you can measure this angle
- 当它到达衍射光栅时,每个波长都以不同的角度偏离。通过查看游标刻度,您可以测量这个角度
Reading the Vernier scale ## 读取游标刻度
- Vernier scale is a very precise way to measure angles.
- 游标刻度是测量角度的非常精确的方法。
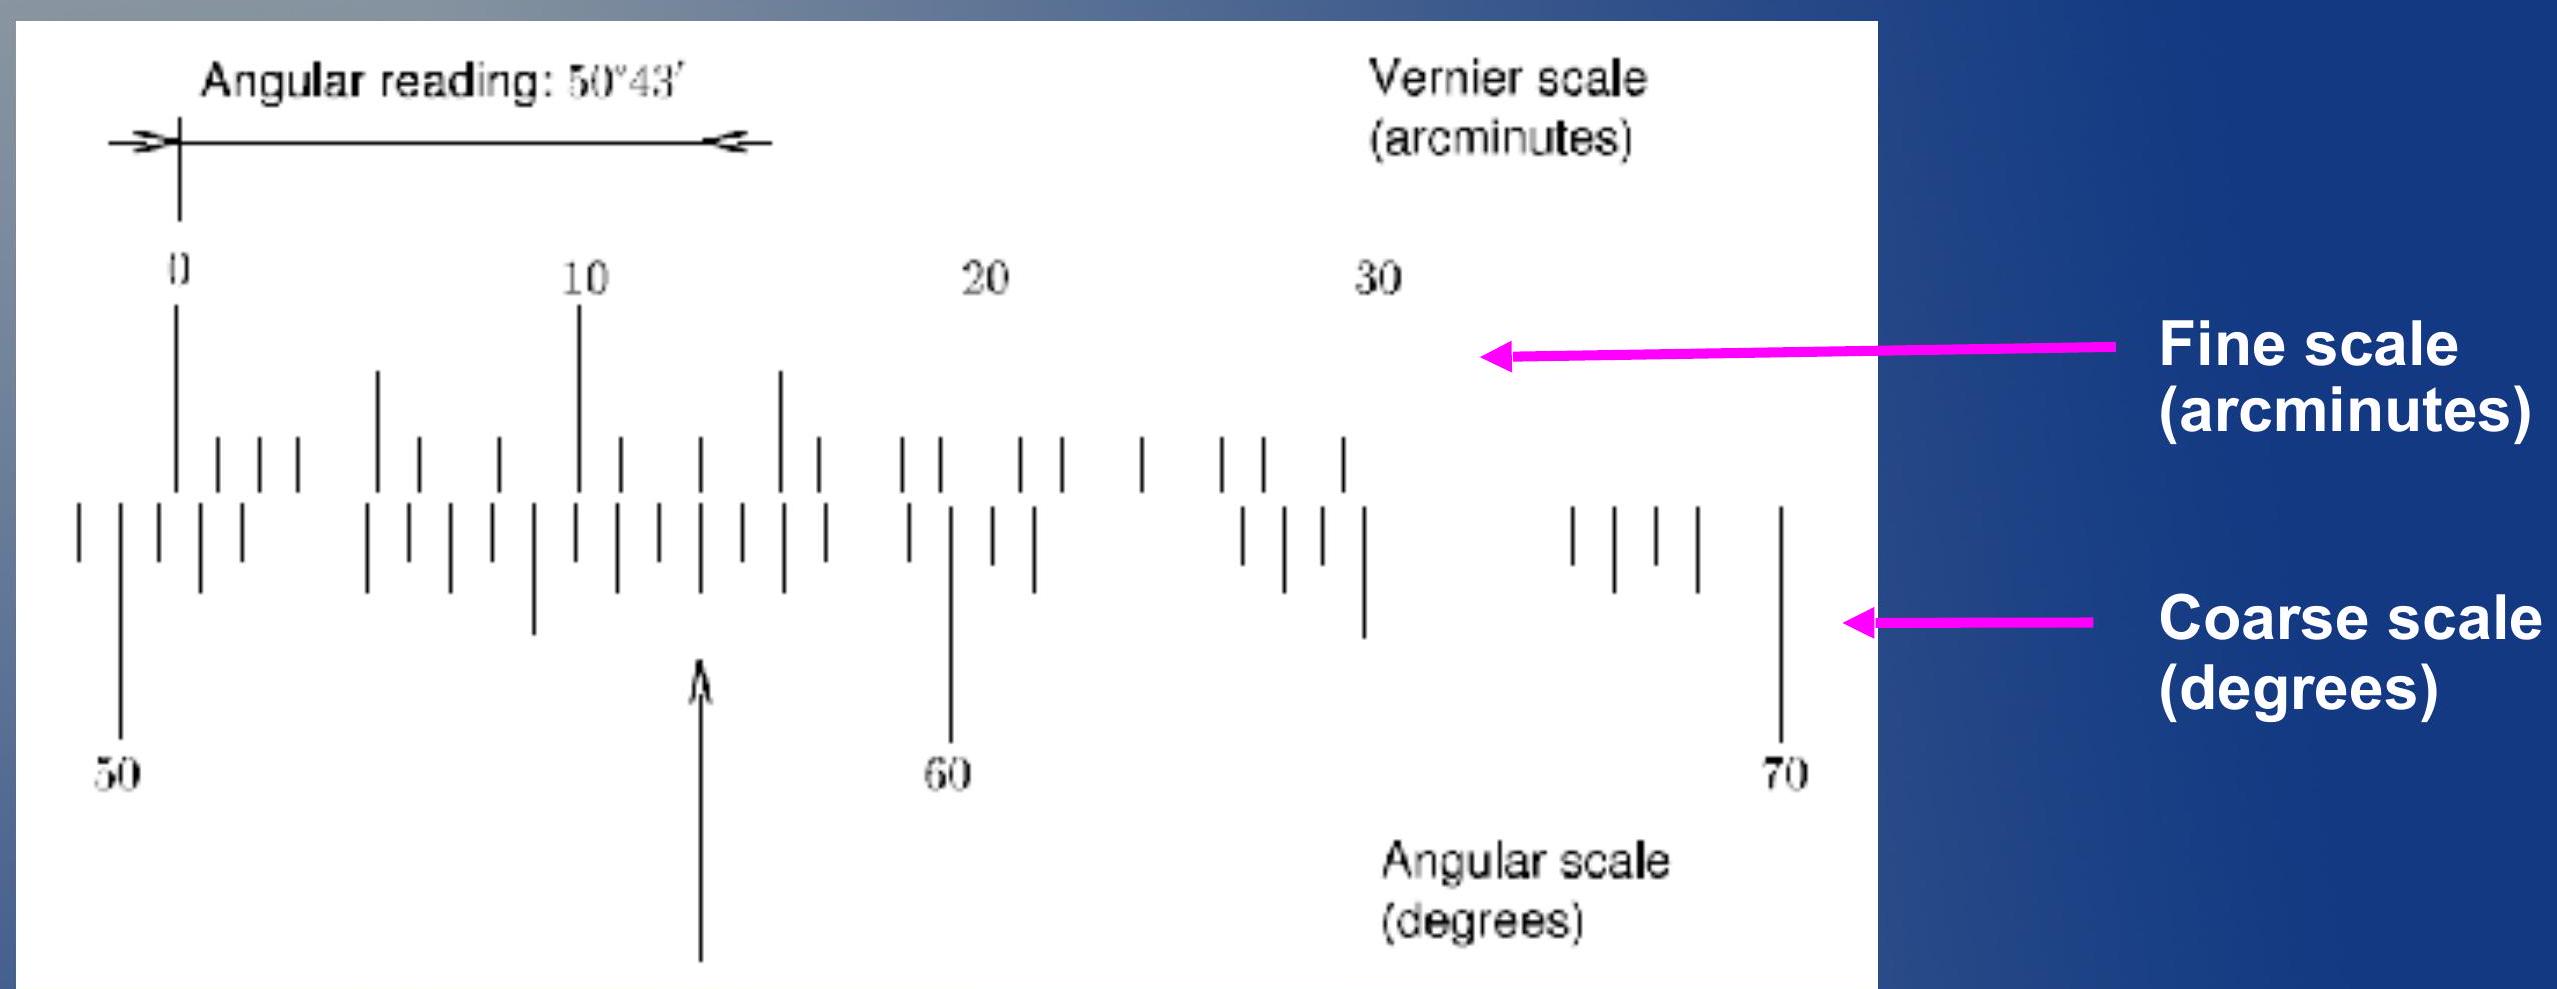
Reading the Vernier scale ## 读取游标刻度
- Vernier scale is a very precise way to measure angles.
- 游标刻度是测量角度的非常精确的方法。
The zero of the arcminute scale will tell you how many degrees you have rotated the apparatus. 50 degrees plus a bit more than 30 arcminutes.
弧分刻度的零点将告诉您旋转装置的度数。50度再加上比30弧分多一点。
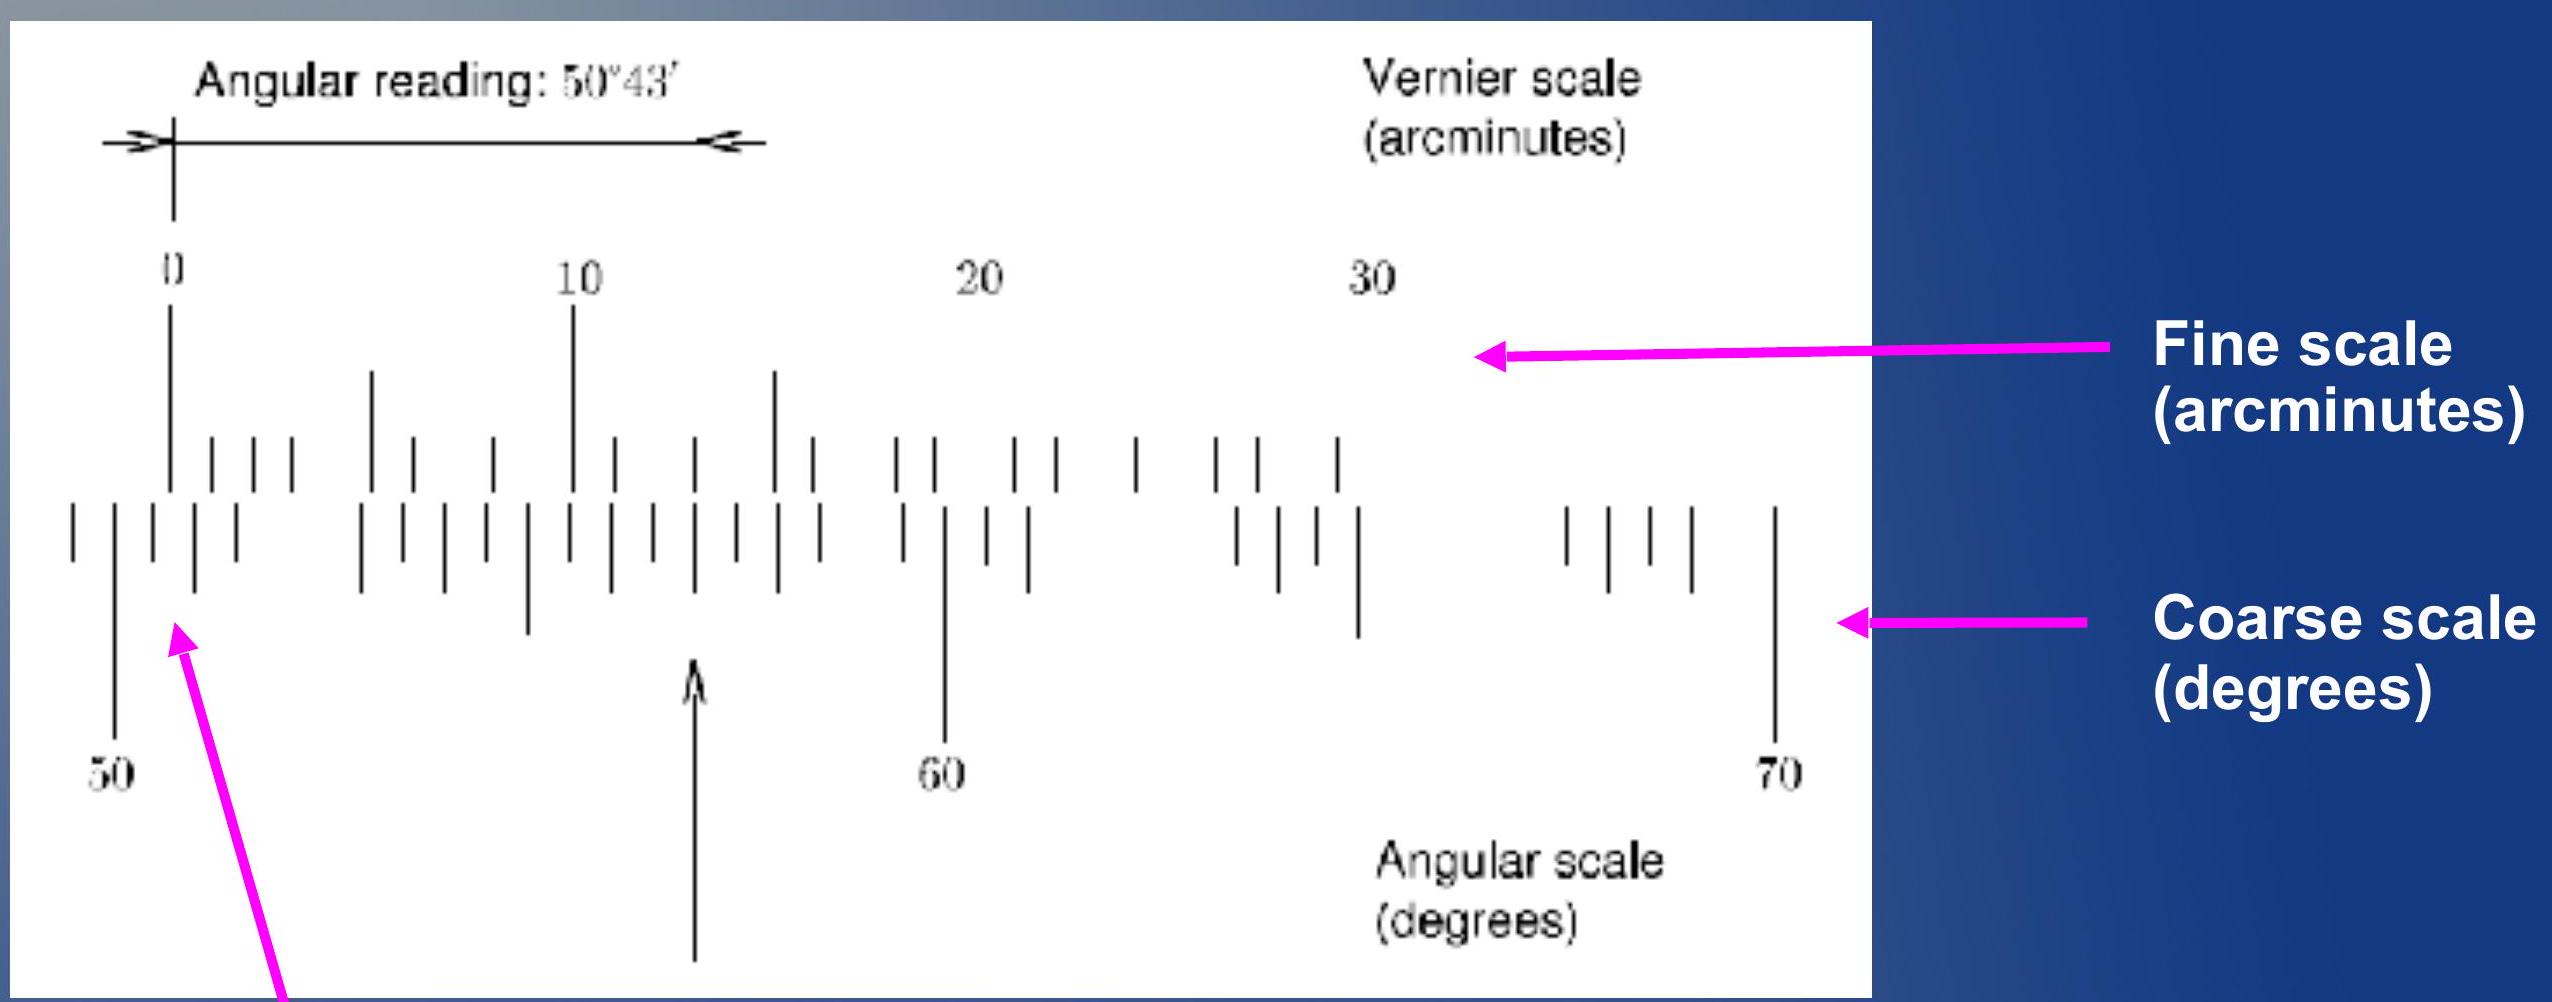
Reading the Vernier scale ## 读取游标刻度
- Vernier scale is a very precise way to measure angles.
- 游标刻度是测量角度的非常精确的方法。
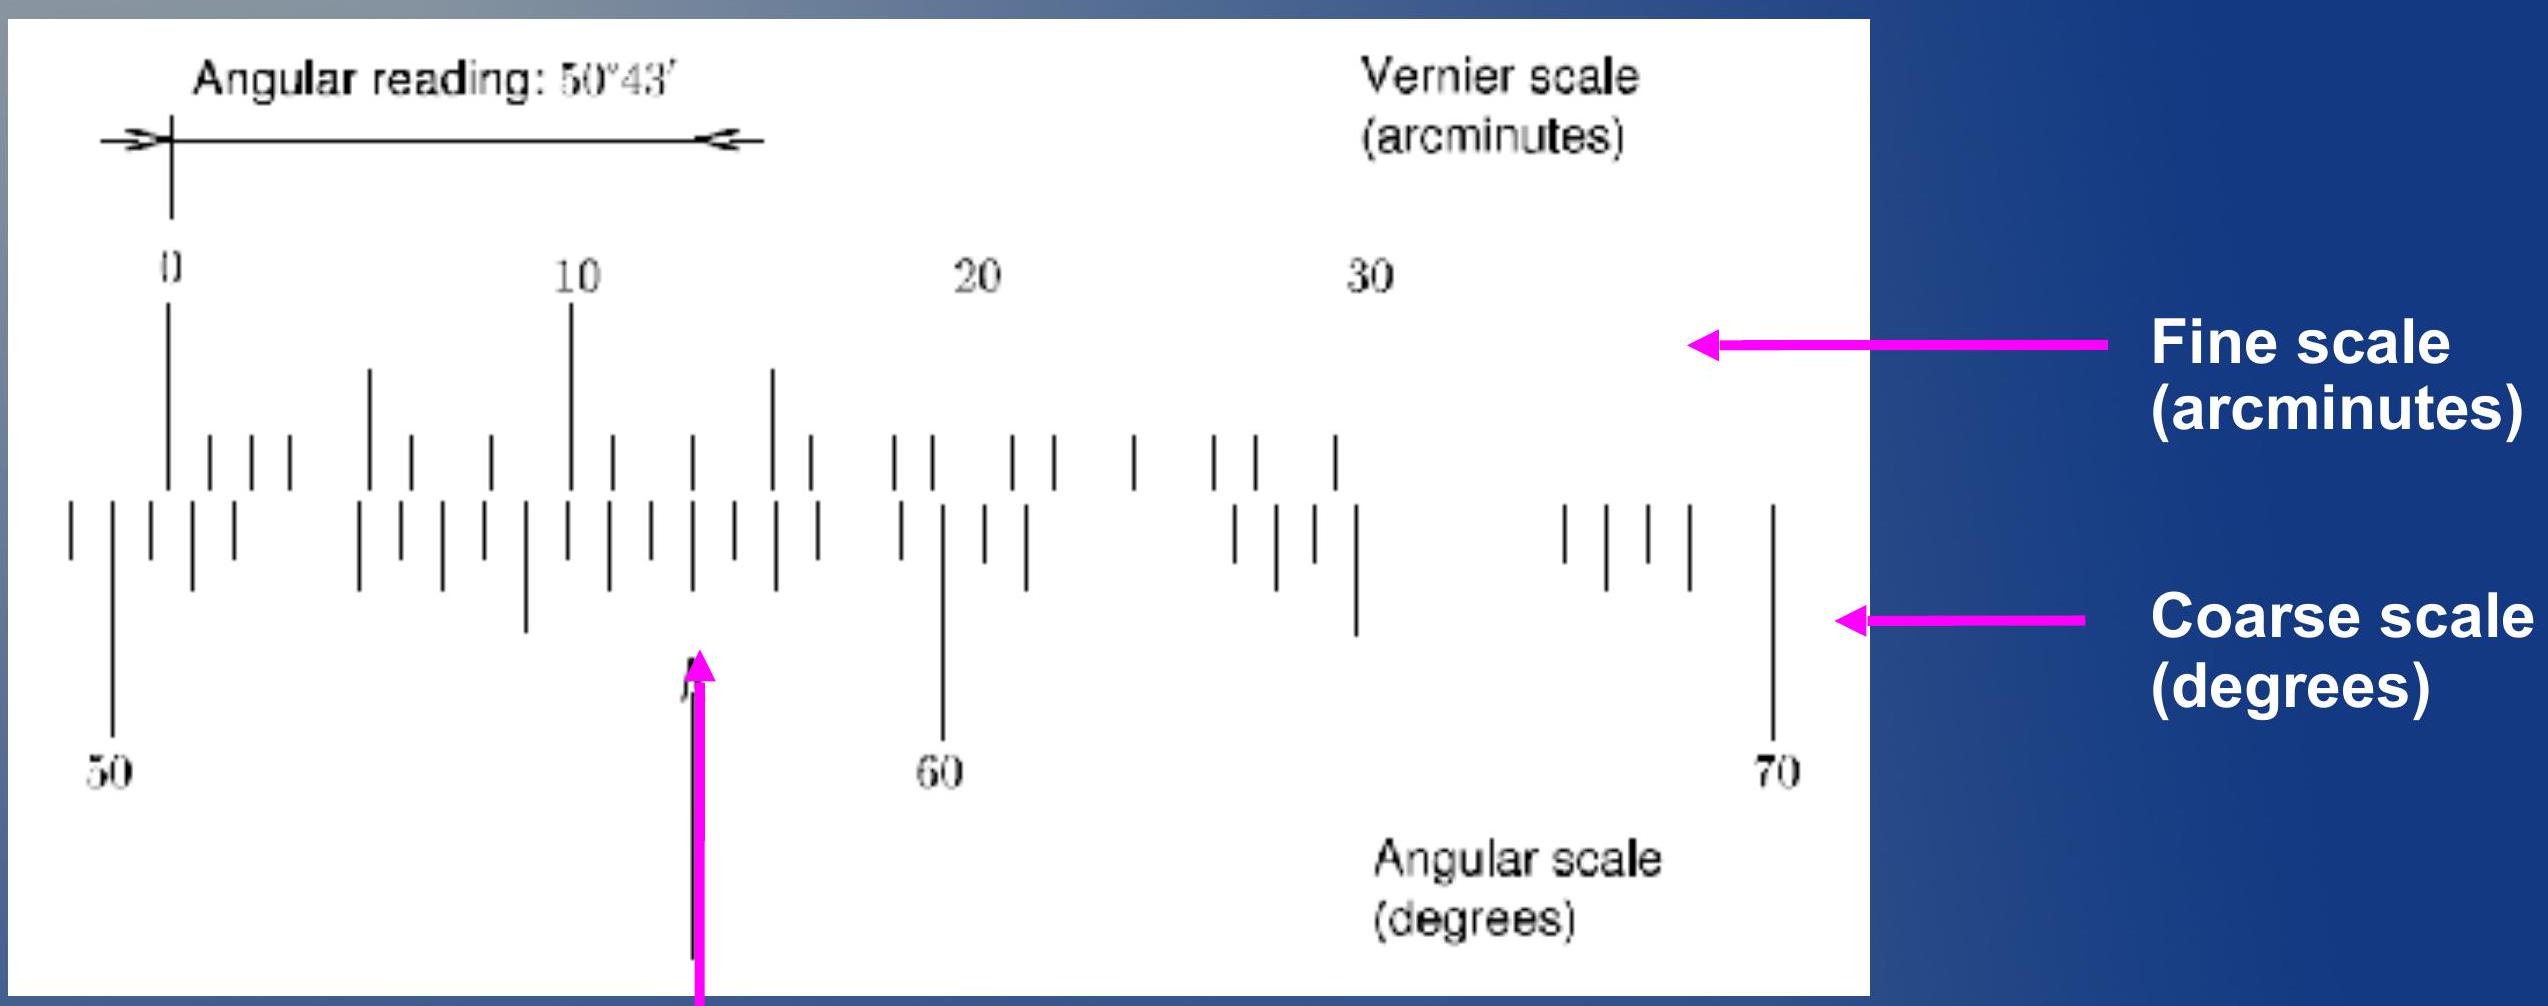
Looking at when the fine scale and coarse scale align you can determine the "little bit". In this case, they are aligned on the 13 mark of the fine scale. So:
观察精细刻度和粗刻度对齐的位置,您可以确定"一点点"。在这个情况下,它们在精细刻度的13标记处对齐。所以:
Part 1: calibration of the grating ## 第一部分:光栅的校准
- Using He lamp (yellow lamp), you will determine what the spacing between adjacent slits is.
- Three steps:
- Align so that order line is at 0 degrees.
- Turn the telescope to the left, find first yellow line ( ) and measure angle .
- Turn the telescope to the right, find first yellow line ( ) and measure angle .
- Make sure to record errors for your angle measurements.
- Take average of both angles. Note that the angle you want to use is the relative angle to the central maximum. This means that your angle must be always between and
- 使用氦灯(黄灯),您将确定相邻狭缝之间的间距。
- 三个步骤:
- 对准使级线在0度处。
- 将望远镜转向左侧,找到第一条黄线()并测量角度 。
- 将望远镜转向右侧,找到第一条黄线()并测量角度 。
- 确保记录您的角度测量的误差。
- 取两个角度的平均值。注意,您要使用的角度是相对于中心极大值的相对角度。这意味着您的角度必须始终在和之间
Part 1: calibration of the grating ## 第一部分:光栅的校准
- Take as a given the wavelength of the yellow line of He:
- 将He的黄线的波长视为已知:
- Using the grating equation and setting , solve for .
- 使用光栅方程并设置,求解。
- Don't forget to propagate errors.
- Your final calibration result should be:
- 不要忘记传播误差。
- 您的最终校准结果应为:
Part 2: Balmer series ## 第二部分:巴尔末系列
- Replace the helium lamp with the hydrogen one
- Procedure:
- For the first and second order lines and do:
- Measure and for each spectral line (i.e. dark-purple, purple, greenish-blue, and red line)
- Calculate the average angle
- Find the wavelengths for each average angle , taking into account the order
- Determine the uncertainty taking into account the error in the angle and the lattice constant .
- Use a weighted average between and to find the final value of for each color
- 用氢灯替换氦灯
- 程序:
- 对于第一和第二级线(和)执行:
- 测量每条光谱线(即深紫色、紫色、绿蓝色和红线)的和
- 计算平均角度
- 考虑到级数 ,找出每个平均角度 对应的波长
- 考虑到角度的误差 和晶格常数 ,确定不确定度 。
- 使用和之间的加权平均,找出每种颜色的最终值
Part 2: initial energy levels ## 第二部分:初始能级
- Recall the Balmer's formula:
- 回顾巴尔末公式:
- Starting from that find the initial level ( ) as a function of the wavelength and the final level ( )
- Assuming find the initial value of associated to each observed wavelength
- You final result will be for each color
- 从这个公式开始找出初始能级()作为波长和终态能级()的函数
- 假设,找出与每个观察到的波长相关的的初始值
- 您的最终结果将是每种颜色对应的
Tips ## 提示
- I feel like this experiment requires to be careful at the following few aspects:
- 我觉得这个实验需要注意以下几个方面:
- The experiment is clearly best performed in a dark environment. Try to screen your apparatus from ambient light in the best way possible (e.g. using the black cloth that you will find on the table)
- As already mentioned, the purple line will most likely look like a dark violet one and it will be quite difficult to see it. If you are having problems with it ask your TA. If that doesn't solve the problem neither, it is ok to skip it
- Remember to always measure your angle with respect to the central line. There are no negative angles!
- 这个实验显然最好在黑暗的环境中进行。尽可能地用最好的方式遮挡您的仪器,避免环境光的干扰(例如使用您在桌子上找到的黑色布料)
- 如前所述,紫线很可能看起来像深紫罗兰色,而且很难看到。如果您遇到问题,请询问您的助教。如果这样仍然解决不了问题,可以跳过这条线
- 记住始终相对于中心线测量您的角度。不存在负的角度!